
Financial Planning Template for Running Your Business
Learn more ->
Get a complete overview of Profit & Loss (P&L); you may not need to create your P&L statement by hand in 2023, as there are smarter and more efficient methods available.


Every finance leader and operator needs to understand how to read and analyze a profit and loss statement. The P&L or income statement will provide you with insights into the performance of a company over a specific period of time by reporting its revenue and expenses. In this article, we will provide you with a comprehensive step-by-step guide on how to create and analyze a profit and loss or income statement.
Content created by: Baha Makarem, FP&A Ops Manager at Abacum
A profit and loss statement is a financial statement that summarizes a company’s revenue, expenses, and net income over a specific period of time. It provides a comprehensive picture of a company’s financial performance and is used by investors, creditors, and leadership to assess the company’s profitability and operational efficiency.
Profit and loss statement, also known as an income statement, is a vital financial statement summarizing a company’s income, expenses, and net income over a specific period. Keep in mind that terminology and presentation can vary across countries and accounting frameworks. Some countries commonly use “profit and loss statement,” while others prefer “income statement.” Additionally, accounting regulations and local practices may influence reporting formats and disclosure requirements. Familiarize yourself with country-specific accounting standards and regulations to ensure accurate and compliant reporting. Don’t forget to pay attention to EBITDA, a crucial metric for evaluating a company’s income.
For a SaaS company the main income statement lines included in a profit and loss template are:
To begin analyzing P&L statements, it’s essential to understand what should be included on a well structured template for a SaaS business. There might be nuances from one company to another, but the following elements are always included:
Revenue is the total amount of money a business generated from the sale of its products or goods. Companies with a SaaS business model normally have 2 categories of revenue:
Cost of Goods Sold (COGS) includes all of the direct costs associated with producing or delivering a company’s products or services. Often a SaaS business will record COGS as “cost of revenue” as there are normally no “physical goods” being sold by the majority of SaaS companies.
Cost of revenue is broken down and reported following the same logic as revenue:
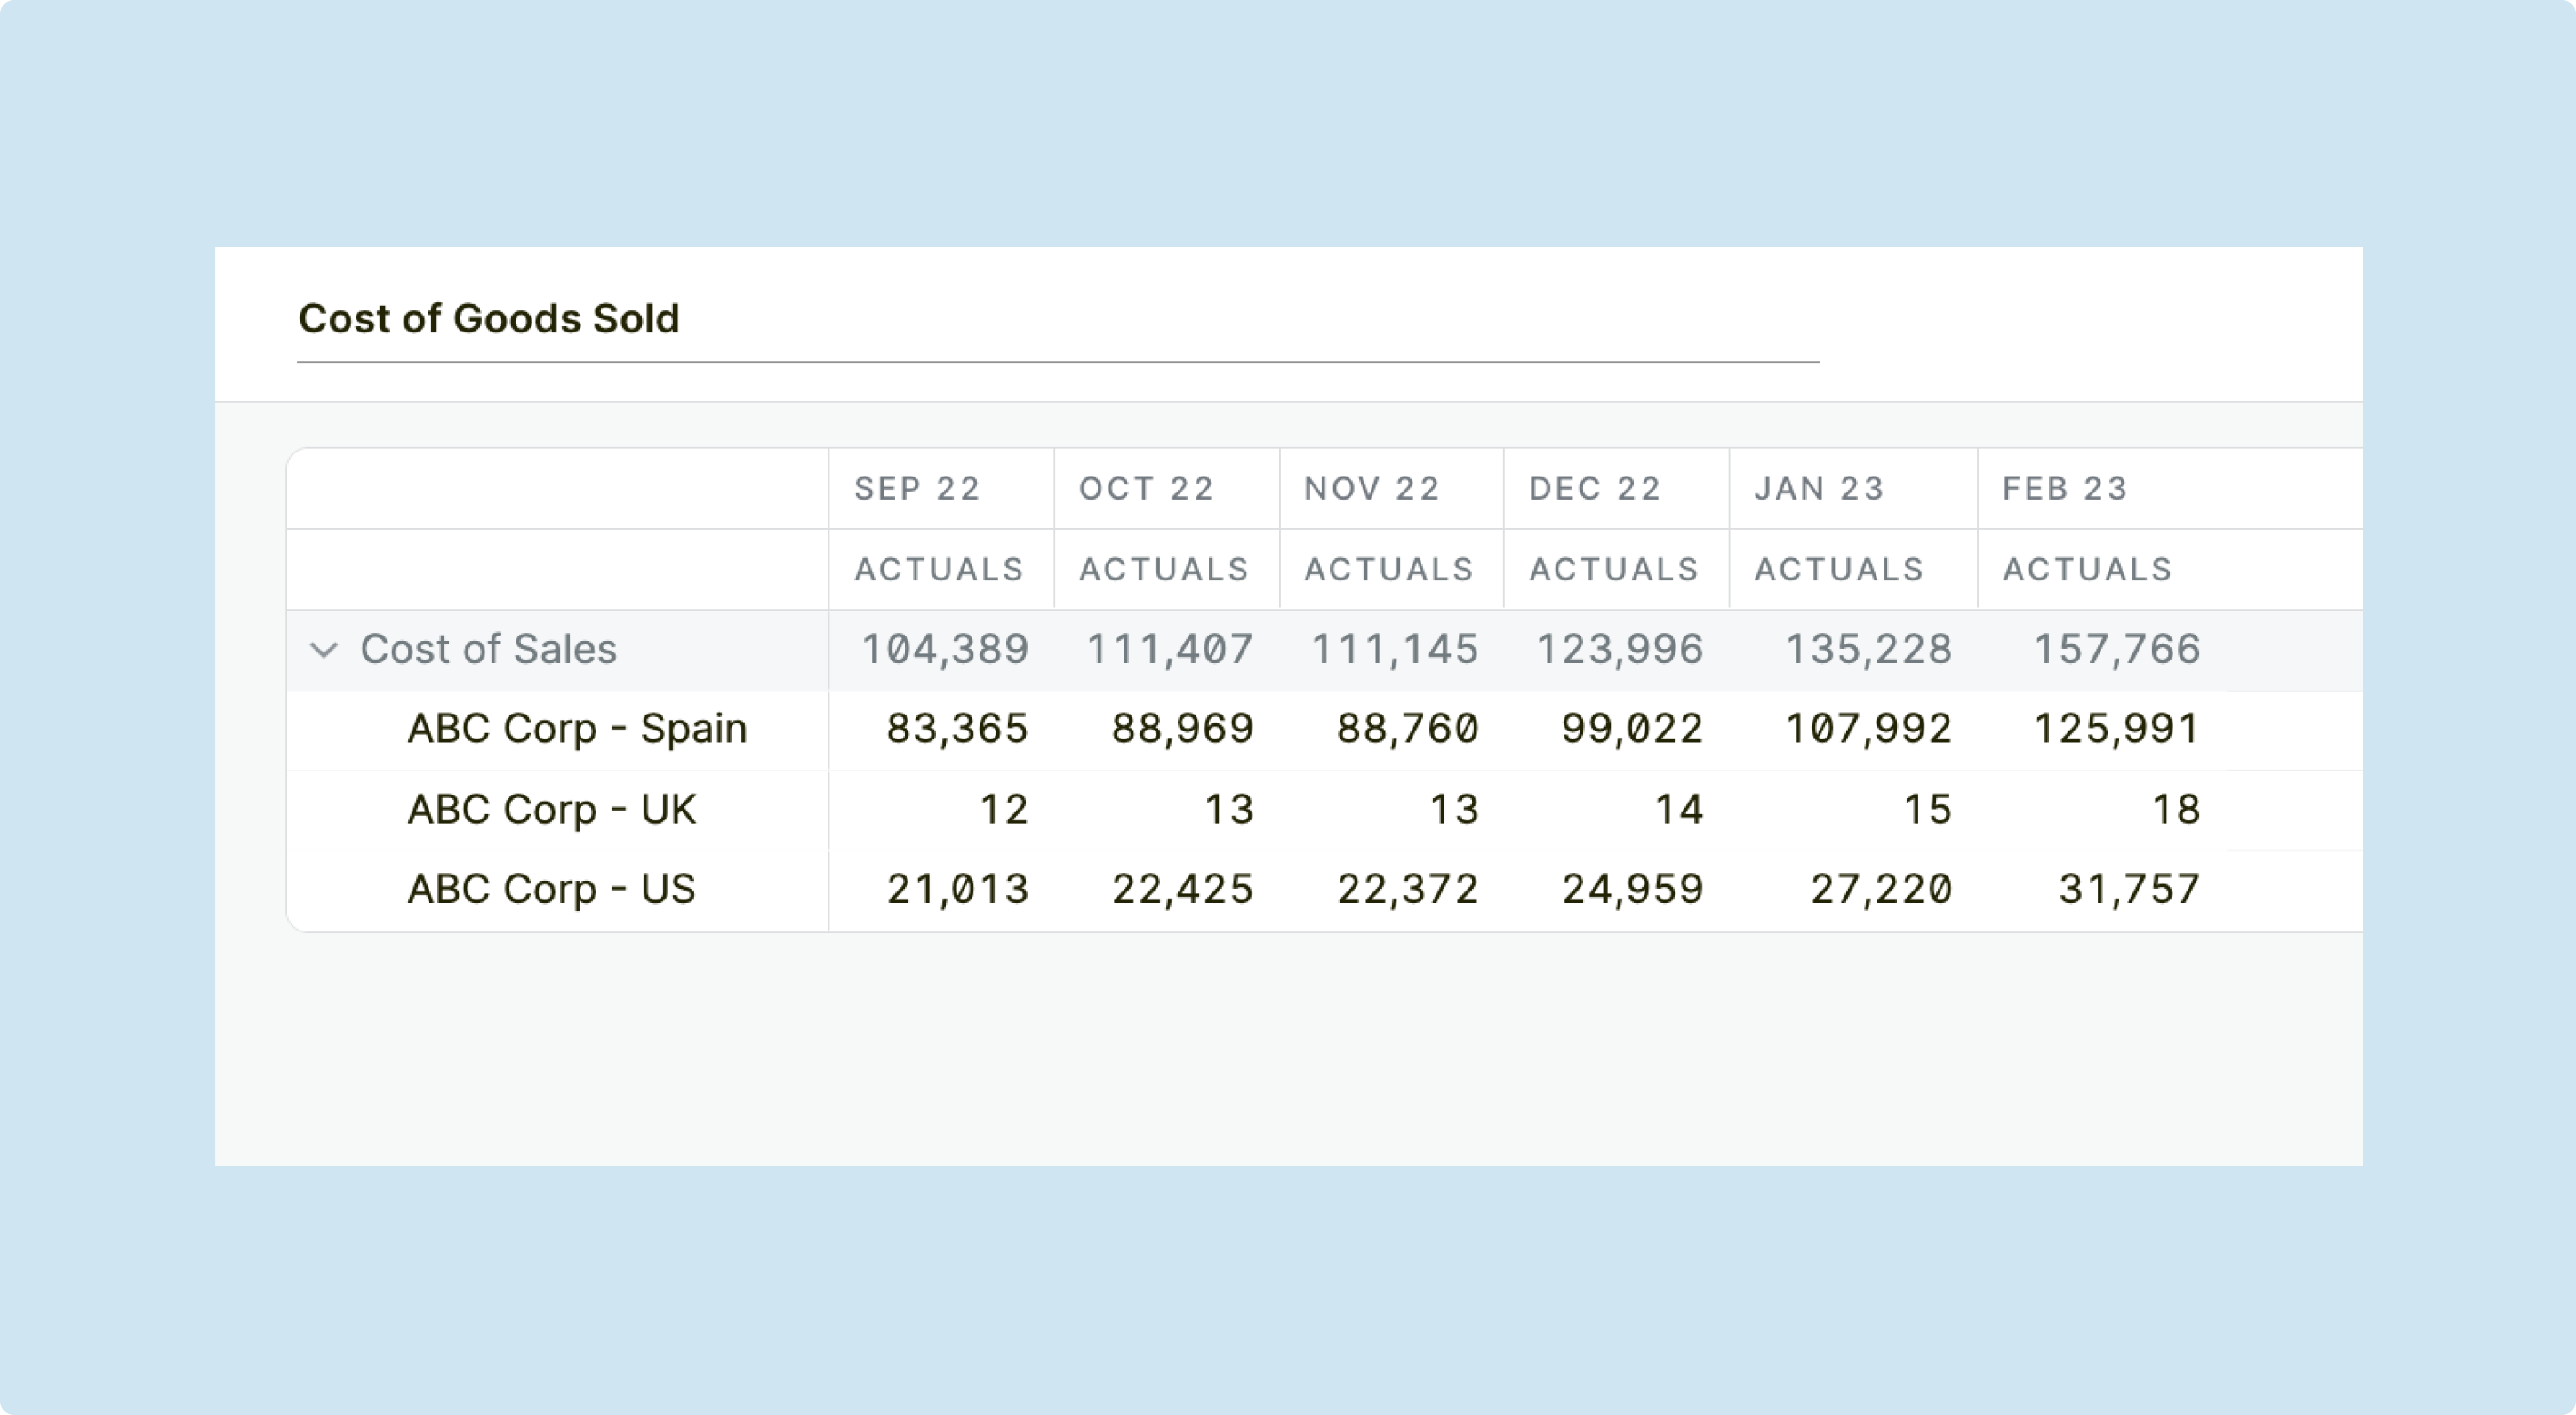
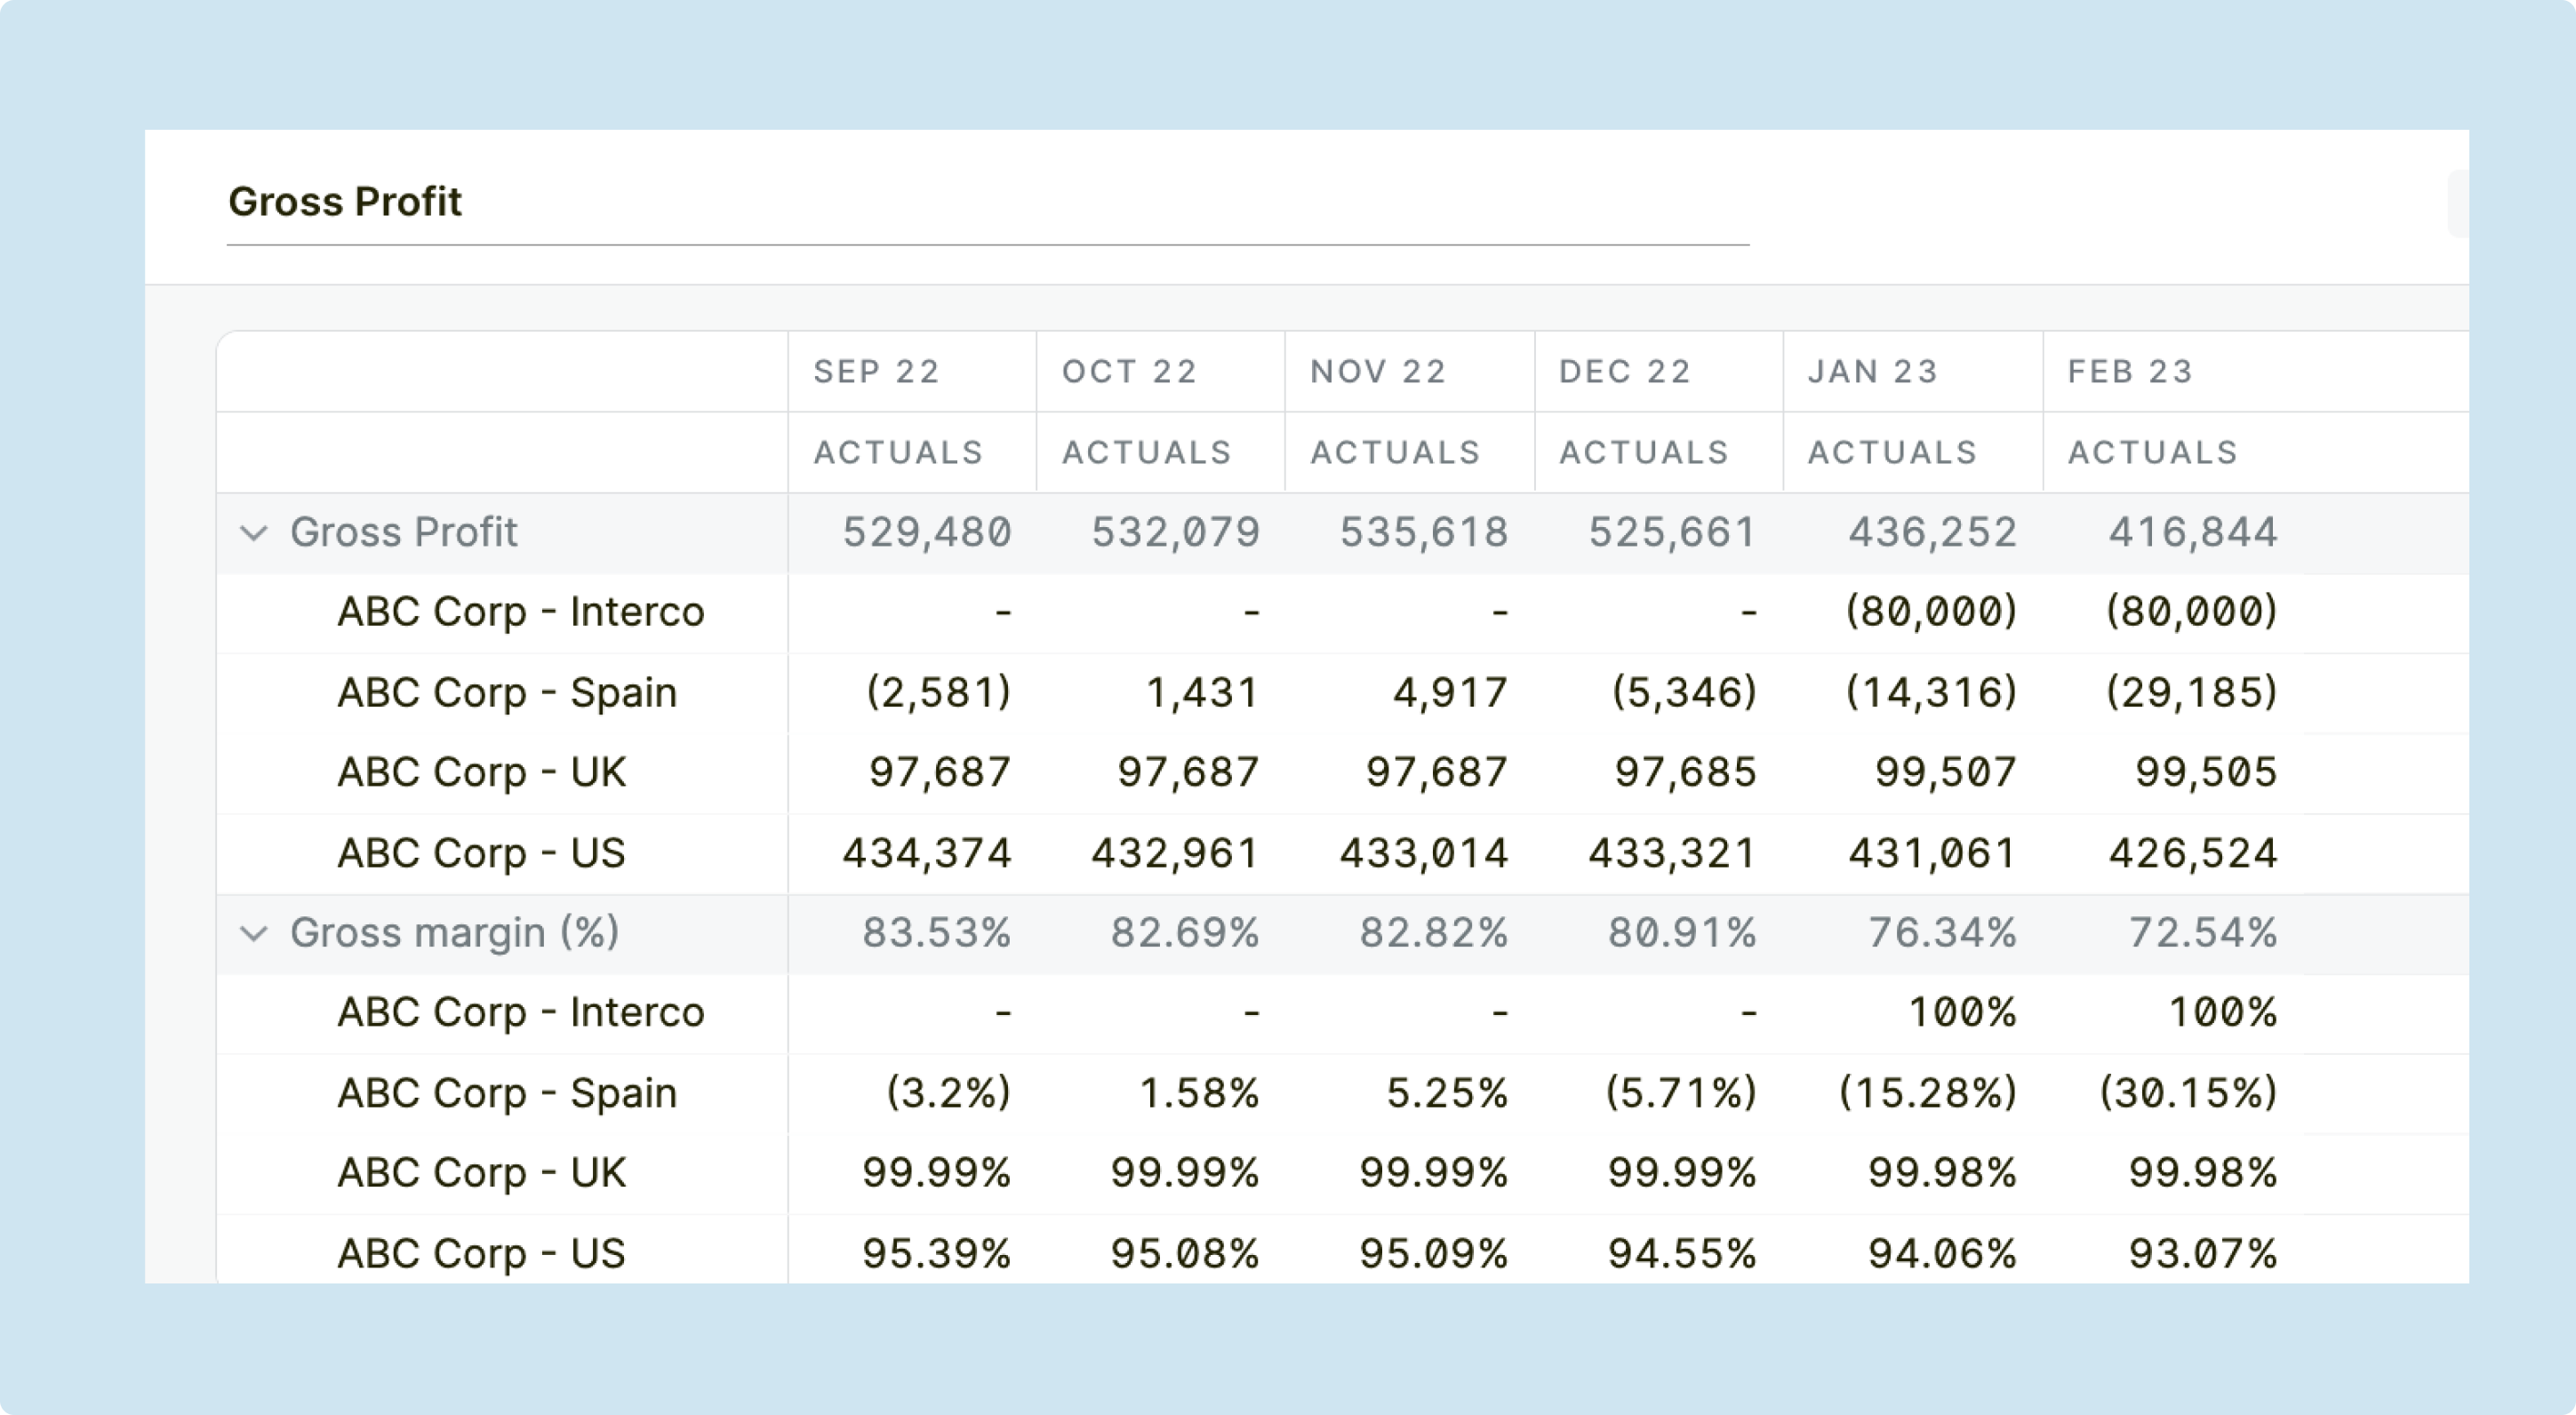
Gross profit (or gross margin) is calculated by subtracting the cost of goods sold from the revenue. Essentially, gross profit will be able to tell you how much profit your business has after subtracting COGS from your revenue. Looking at the formula below, we can see gross profit as a percentage of revenue. This creates a more comprehensive picture as it can be easily benchmarked against other similar businesses.
Operating expenses include all costs incurred in running the day-to-day operations of the business, such as rent, salaries, and marketing expenses. The operating expenses of SaaS business are often broken down into the following groupings within a profit and loss statement.
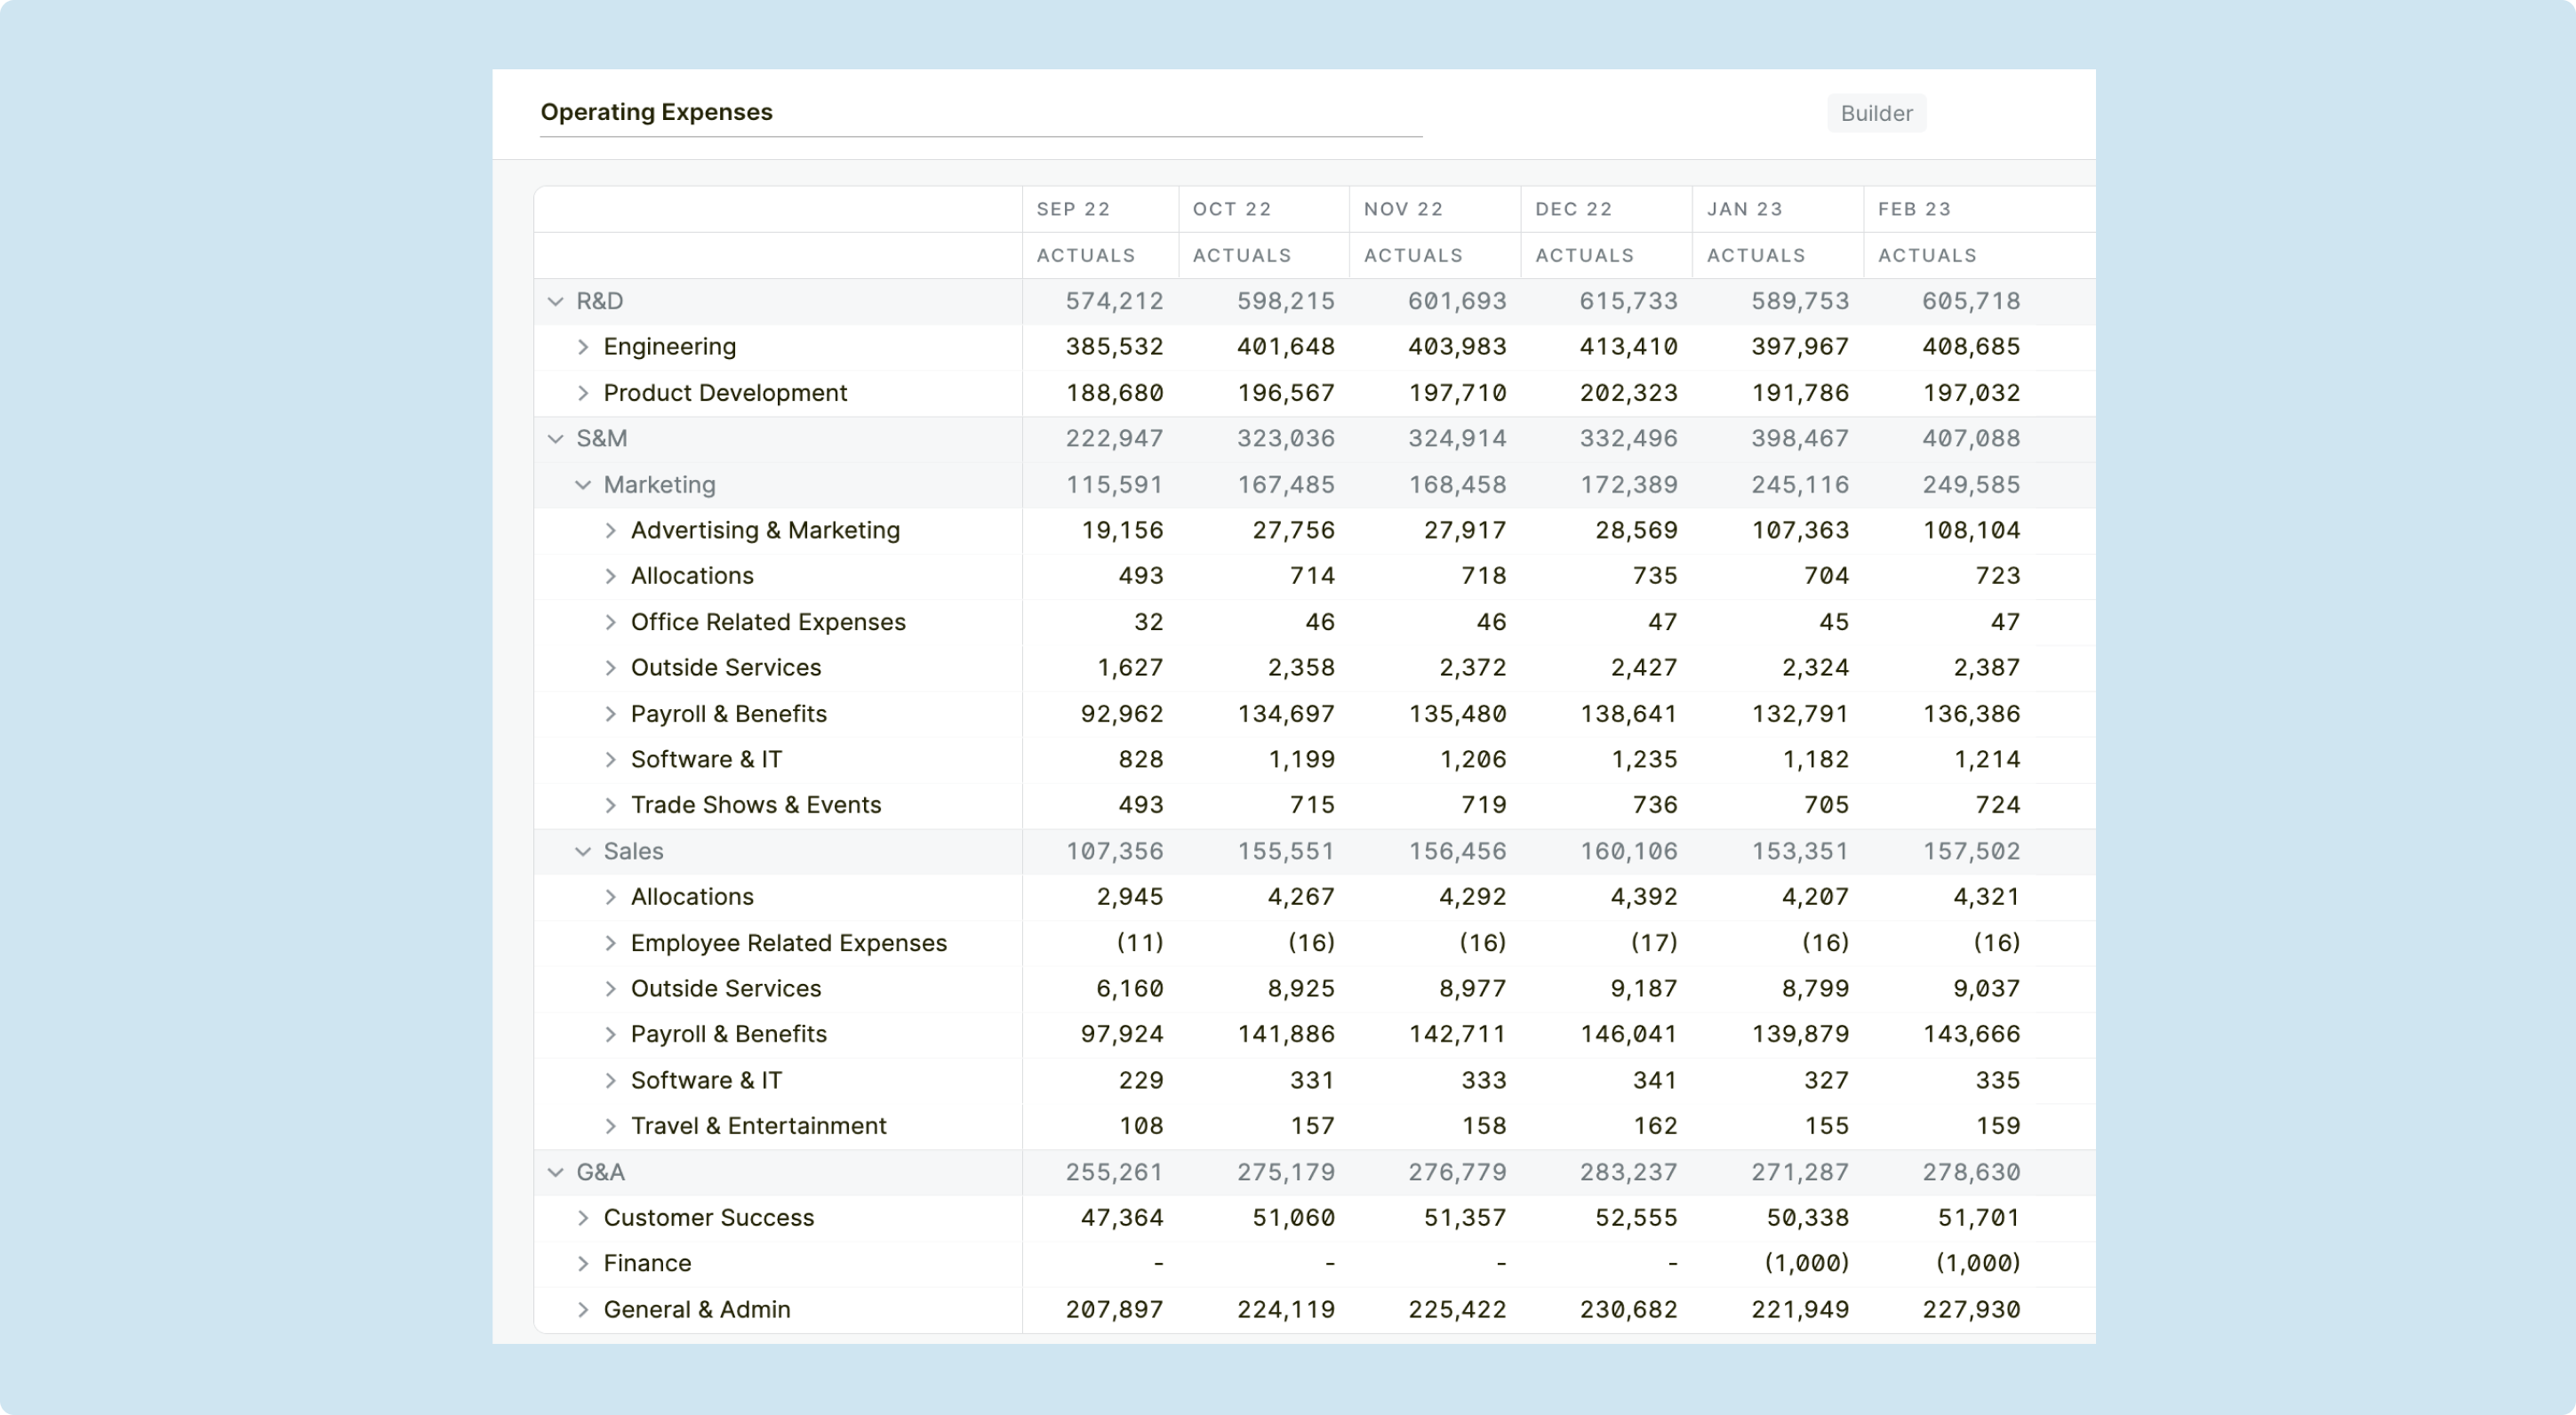
Within this grouping you can drill-down into the following expenses:
Within this grouping you can drill-down into the following expenses:
Within this grouping you can drill-down into the following expenses:
Additionally, there are certain expenses that are often allocated across the above expense groups based on headcount or another allocation method.
Some examples include:
Operating income is calculated by subtracting the operating expenses from the gross profit.
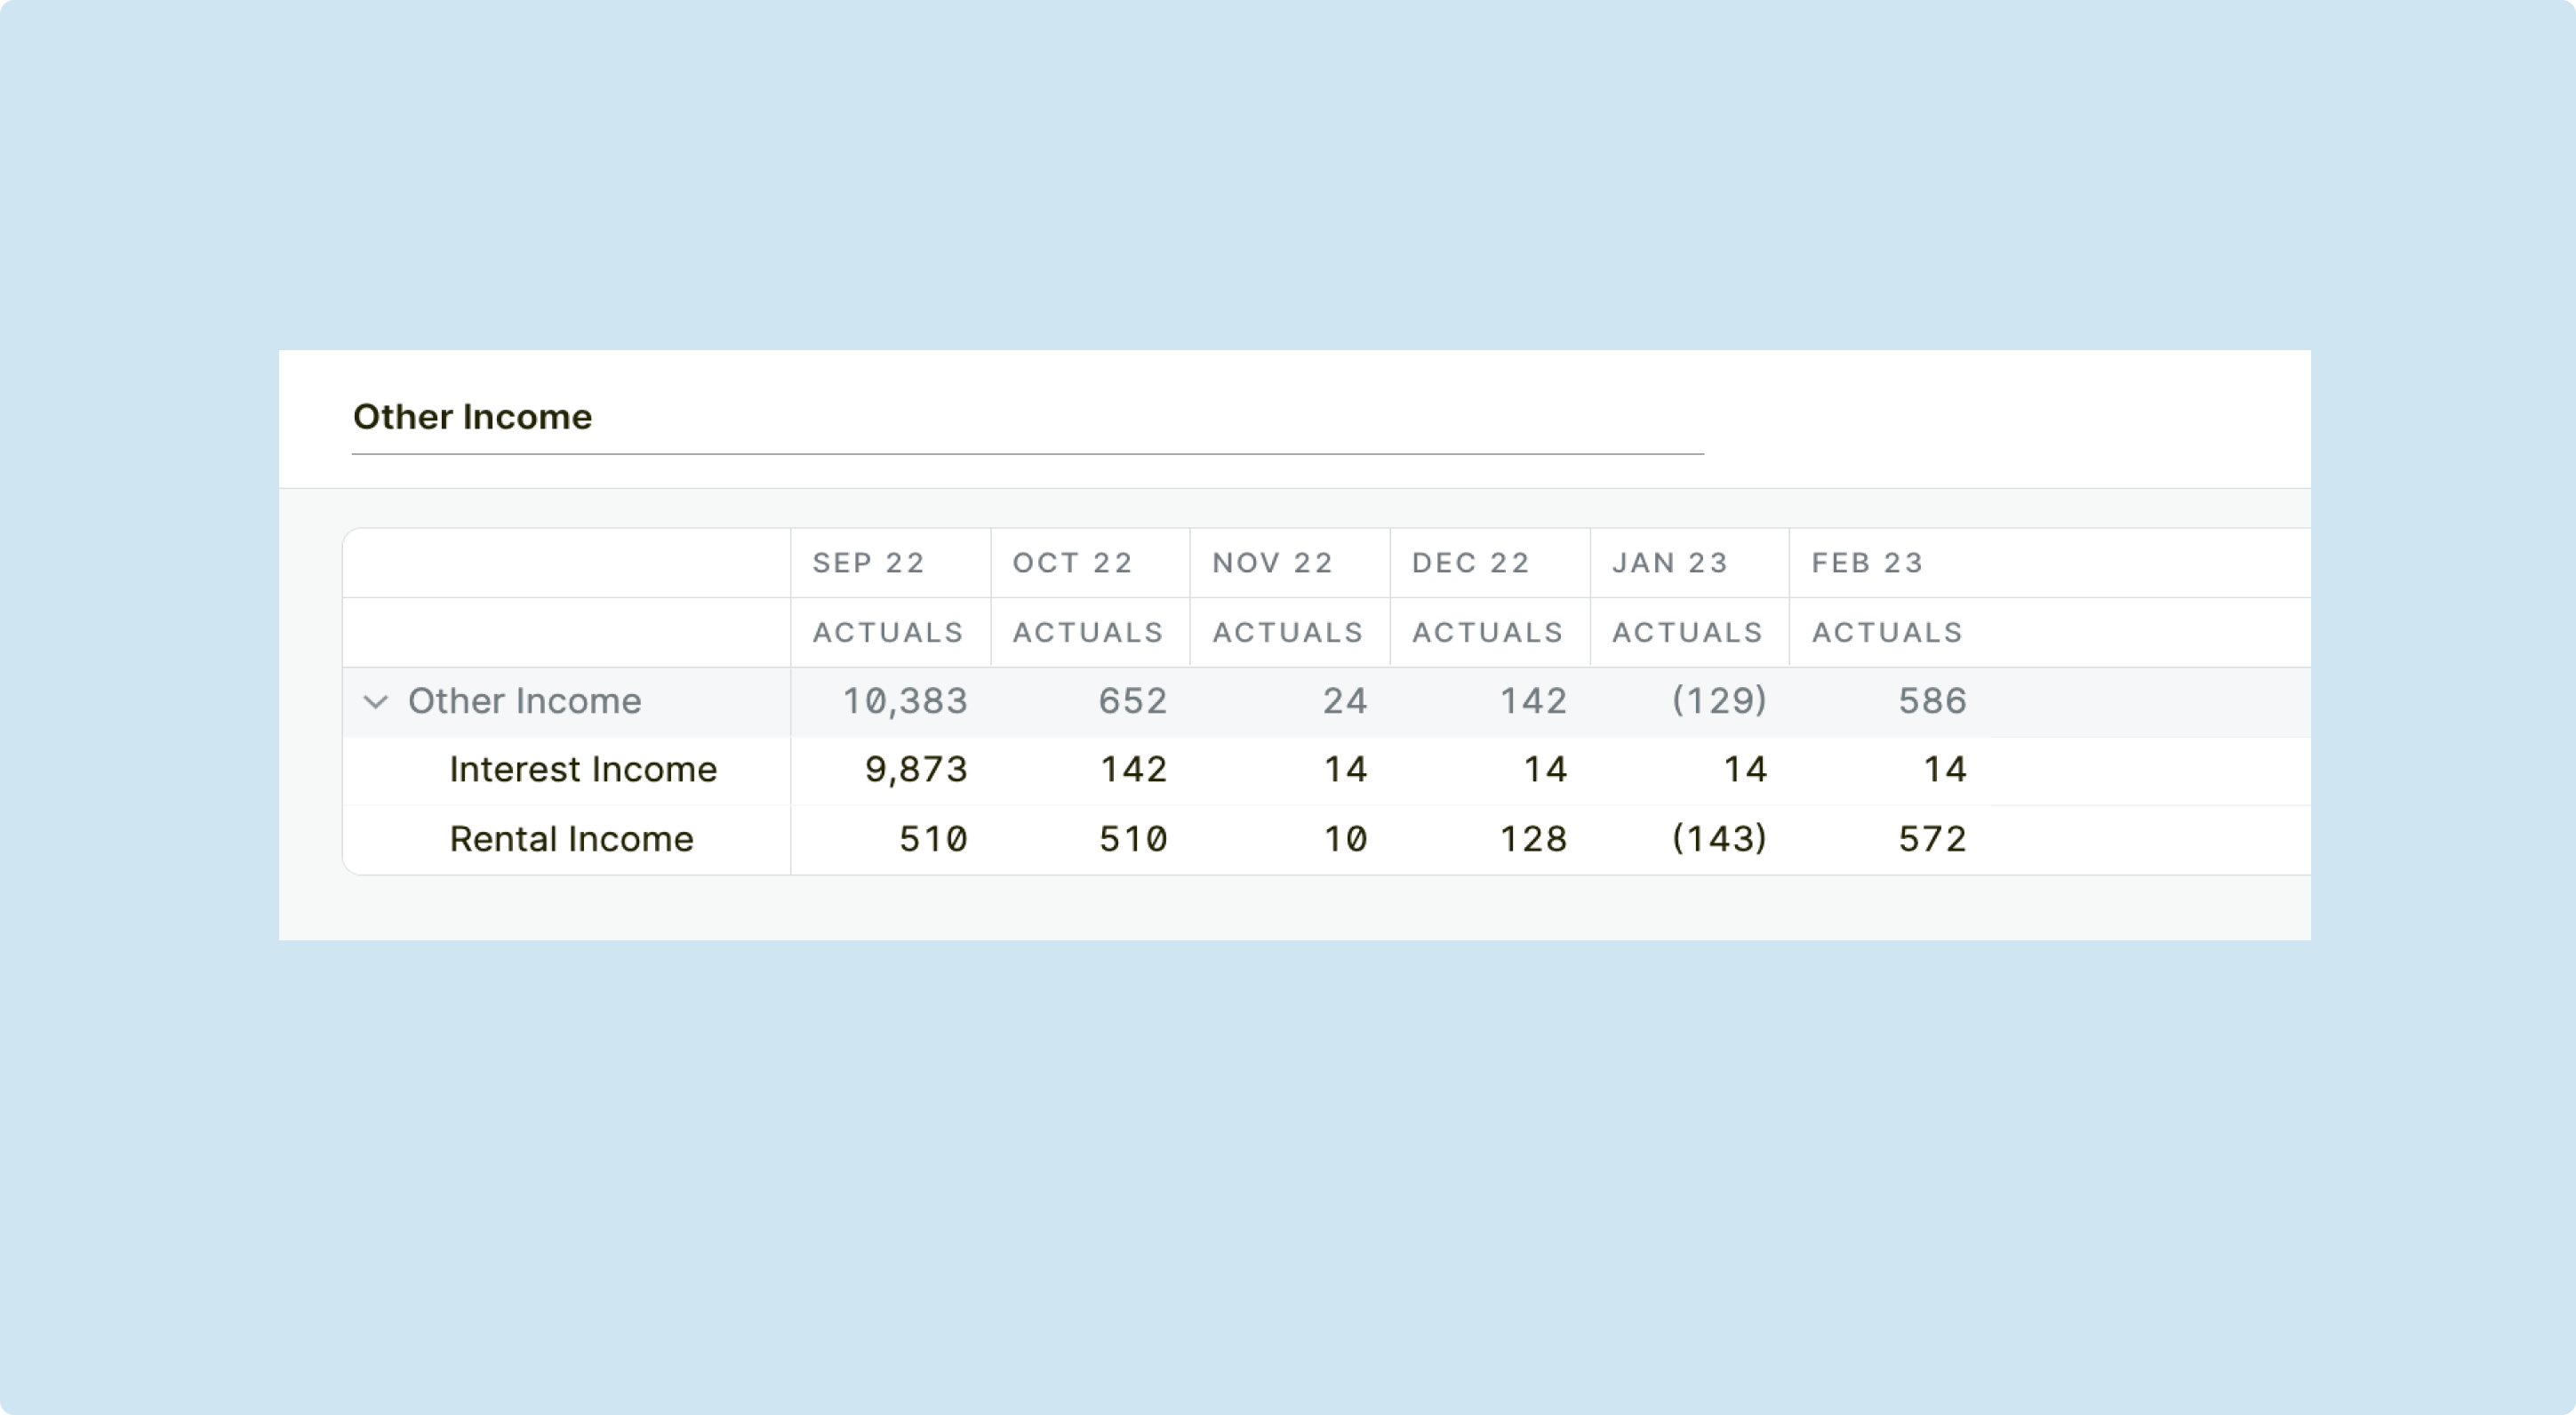
Other income and expenses includes non-operating items like interest income, interest expense, and gains or losses from the sale of assets.
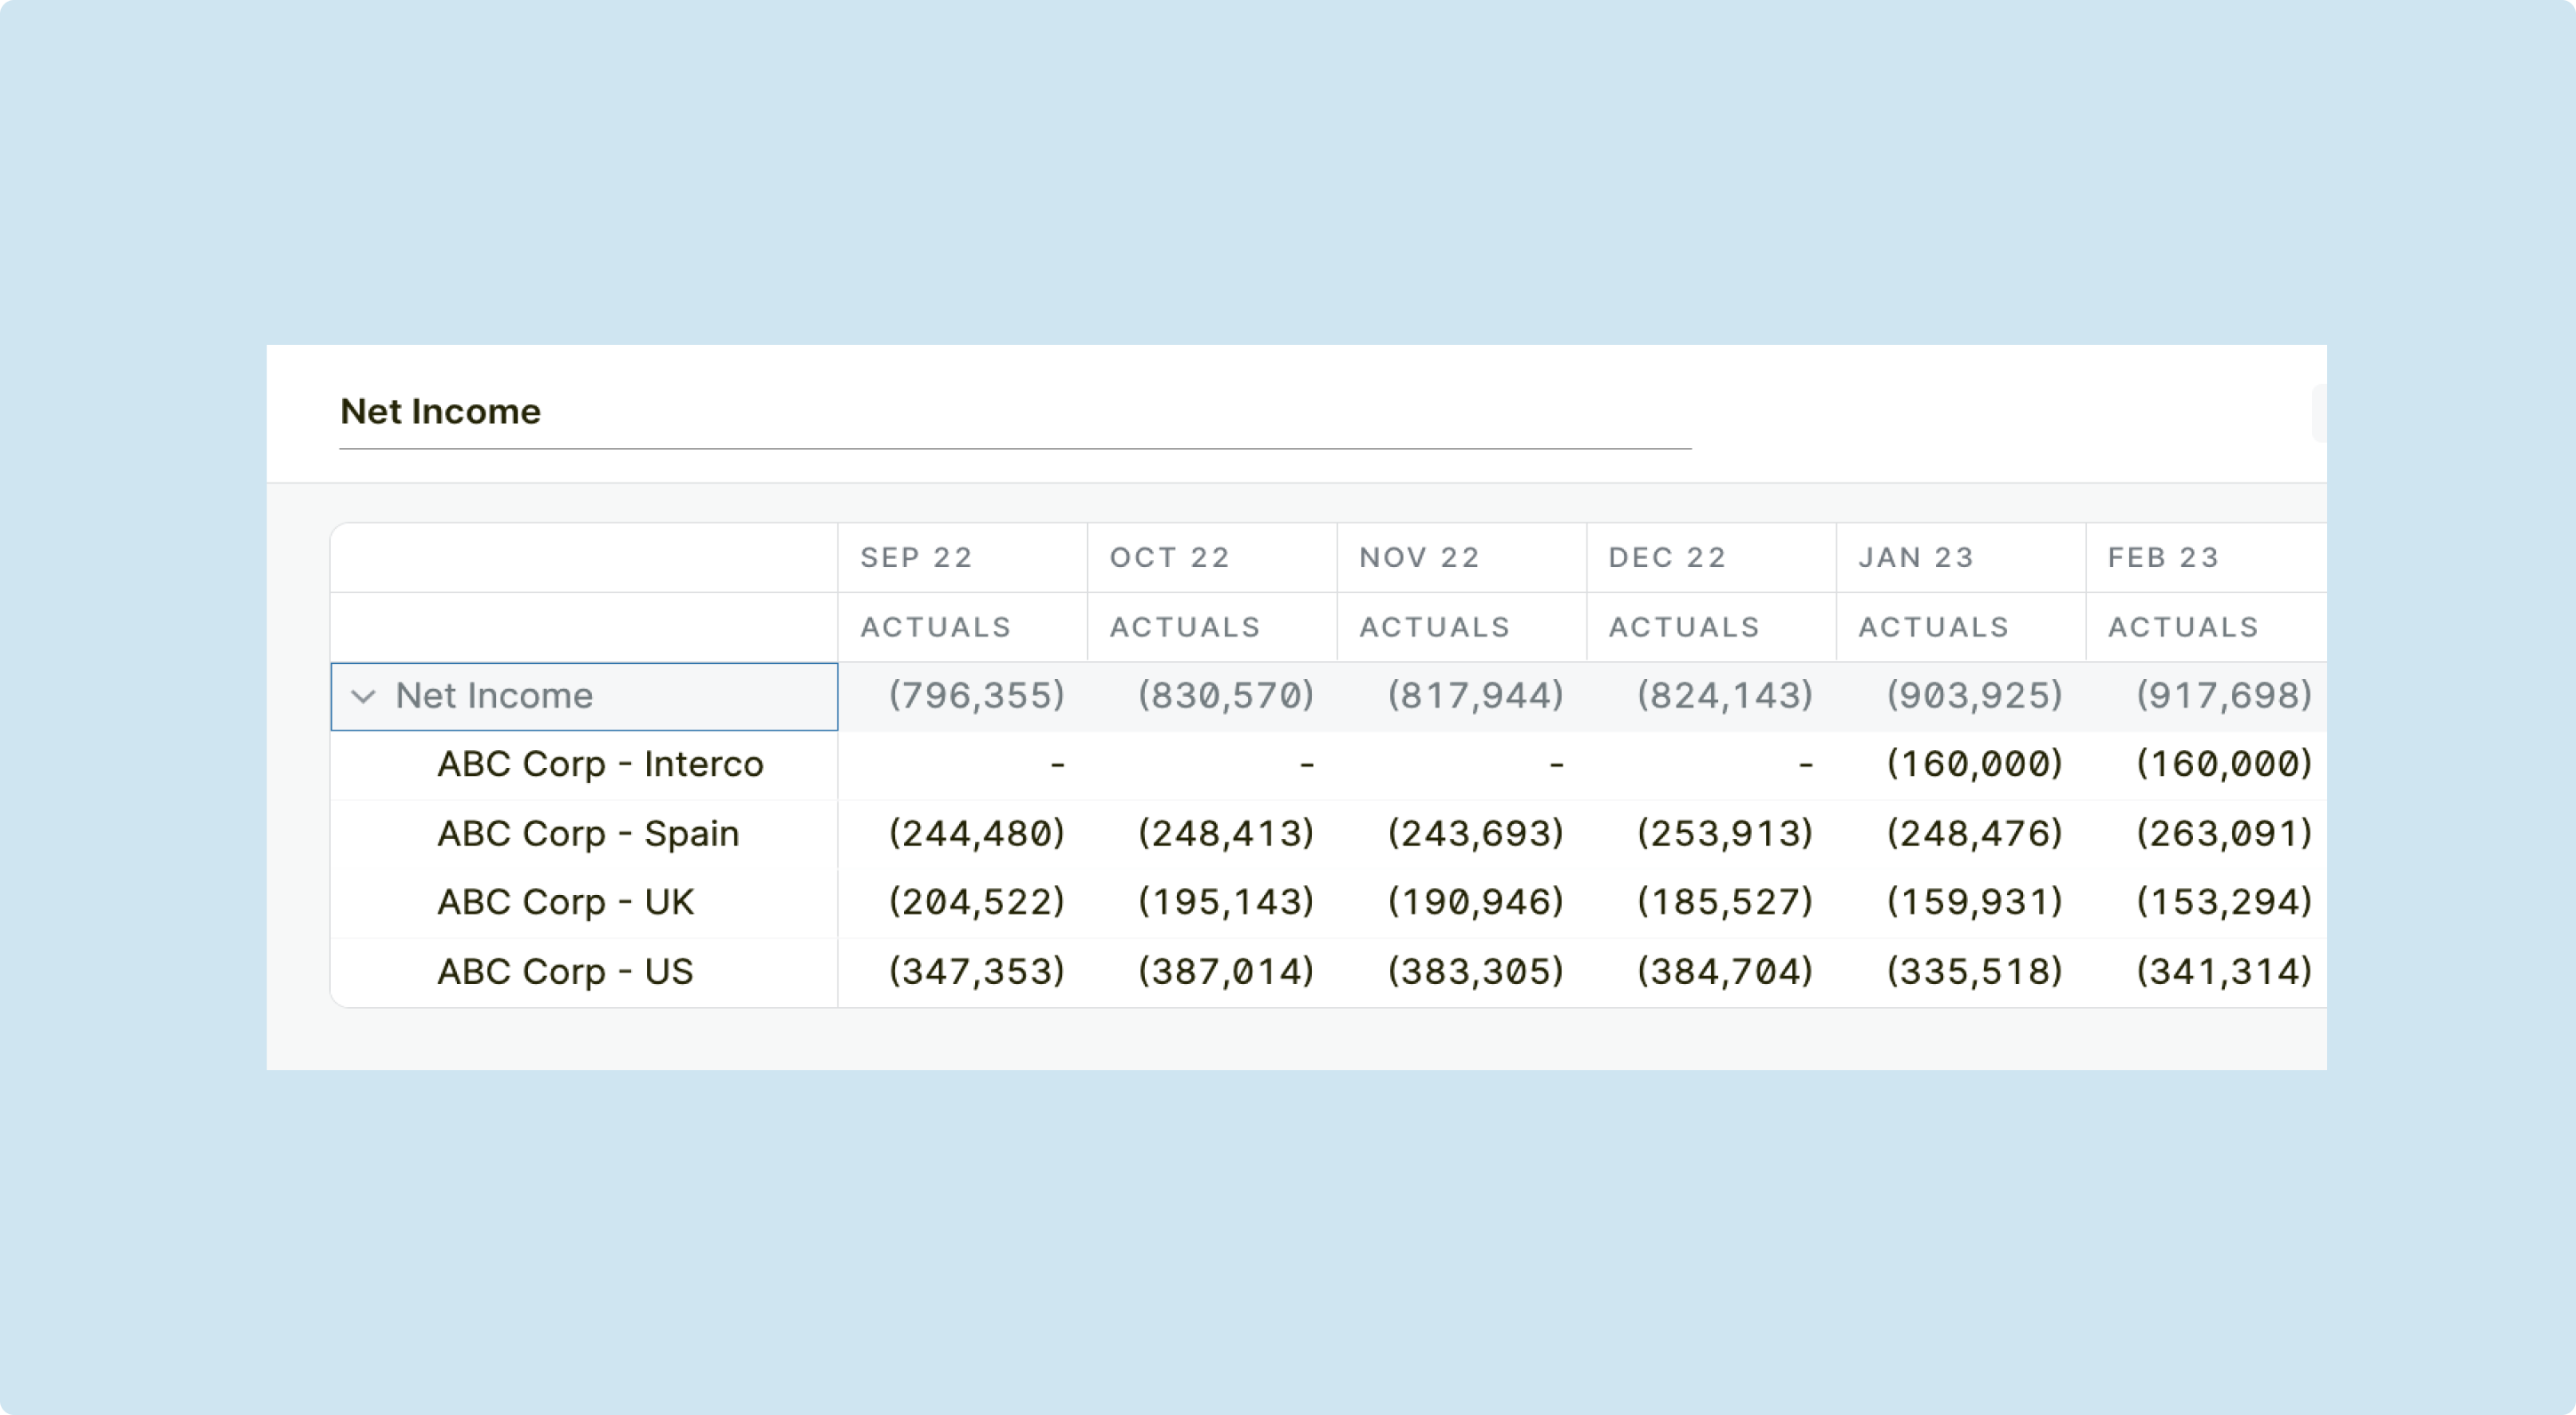
Net income represents the company’s bottom-line monthly profit after accounting for all expenses and taxes. It is calculated by subtracting other income and expenses from the operating income.
By leveraging a profit and loss template, you will be able to easily track and analyze key financial indicators such as gross profit, operating profit, and net profit. These indicators will help you determine the health and performance of your business, enabling you to make data-driven decisions.
Additionally, a P&L template also allows you to visualize your revenue and expenses, giving you immediate clarity on which areas of the business are thriving and which ones require a double click on. The time savings of using an income statement template empower you to spend your time identifying cost-saving opportunities, optimizing your revenue streams, and making informed business decisions. As opposed to manually allocating expenses in a spreadsheet.
For example, let’s assume you operate in a fast growing SaaS business. By leveraging a profit and loss template, you can out of the box track your revenue from different product lines, such as product, countries, or sales motions. This allows you to identify which products are generating the most profit, and which ones may need some adjustments in terms of pricing or marketing strategies. Additionally, the template helps you keep track of your expenses, such as GTM costs, giving you a comprehensive view of the financial performance of your business.
To create your profit and loss statement template you can follow the steps below:
ERP solutions like NetSuite or Sage are crucial for achieving business success, benefiting not only SMBs and mid-size businesses but also small business owners. These solutions empower businesses to convert static spreadsheets into dynamic assets by streamlining the management of essential financial processes within their ERP system. By leveraging an ERP, businesses can enhance financial accuracy by reducing the time taken for month-end closing processes and automating financial reporting. These examples highlight the practical ways in which an ERP can be utilized to optimize financial operations.
Using a customized profit and loss template offers numerous benefits for SaaS businesses:
For instance, if you observe that a specific product line consistently generates substantial profits, it can be advantageous to allocate additional resources towards marketing initiatives to further amplify its sales.
When conducting a thorough analysis of P&L statements, you have 2 primary approaches: horizontal analysis and vertical analysis.
Also known as trend analysis, horizontal analysis compares financial data over multiple periods to identify trends and patterns. It allows you to assess the company’s performance over time and identify areas of improvement or concern.
Vertical analysis, on the other hand, compares each item on the P&L statement to the total revenue. This approach helps you understand the relative importance of each expense or income category and identify any significant deviations.
Both horizontal and vertical analysis provide valuable insights, and the choice between them depends on your specific analytical objectives and preferences.
One of the primary challenges in P&L management is the time-consuming nature of the process. Many businesses struggle with collecting and reconciling data from their different business systems, which can be a tedious and error-prone task.
Leveraging a Financial Planning and Analysis (FP&A) solution can automate the data collection from these systems and significantly reduce the time and effort required to gather financial information, automatically pulling in all of the necessary data for P&L analysis.
To make informed decisions, you need access to the most up-to-date financial data. However, many businesses rely on outdated reports, leading to inaccurate analysis and delayed decision-making. By embracing real-time reporting tools, businesses can stay ahead of the curve and make timely decisions based on accurate financial data.
Variance analysis helps identify deviations from expected outcomes, providing insights into the factors impacting profitability. However, conducting manual variance analysis can be complex and time-consuming.
By leveraging a solution like Abacum, businesses can automate the variance analysis process and gain a deeper understanding of the factors influencing their P&L. This can enable them to make data-driven decisions to optimize profitability and drive business growth.
Furthermore, Abacum comes with advanced visualization capabilities, allowing businesses to easily interpret and communicate the results of a variance analysis. This can facilitate better collaboration and alignment across departments, ensuring that everyone is on the same page when it comes to understanding the financial performance of the business.
Abacum is a powerful FP&A platform designed to simplify P&L management for businesses of all sizes. One of its key features is the availability of pre-built P&L templates, which eliminate the need for you to manually create and update P&L statements from scratch.
Abacum’s pre-built P&L templates offer flexibility beyond a single view, allowing customization based on your specific business needs and data sources. These templates can be tailored to include additional details, such as aligning the P&L with broader company objectives and KPIs.
With Abacum’s income statement templates, businesses can generate accurate and comprehensive P&L statements in minutes. The templates are customizable and easily adaptable to each business’s unique needs, providing a hassle-free approach to P&L management.
Effective P&L management is essential for businesses to thrive in today’s competitive landscape. By understanding the basics, overcoming common challenges, and implementing the right strategies, businesses can enhance their financial performance and drive sustainable growth. With tools like Abacum, businesses can simplify the P&L management process, allowing them to focus on making strategic decisions based on accurate financial insights.
A Profit and Loss (P&L) statement, also known as an income statement, is a financial report that summarizes the revenues, costs, and expenses incurred during a specific period. It provides information about a company’s ability to generate profit by increasing revenue, reducing costs, or both.
Typically, the CFO, VP of Finance, or FP&A managers are responsible for managing and monitoring the P&L in SaaS companies. They ensure the business income and business expenses are accurately recorded and analyzed.
Forecasting P&L involves predicting future business income and expenses. This can be done by analyzing historical data, using financial modeling in Excel, and making educated assumptions about future performance. Key line items like revenue growth, cost of goods sold (COGS), and operational expenses are commonly considered in the forecast.
A P&L statement records revenues, costs, and expenses during a specific period, helping to calculate business profit or loss. On the other hand, a balance sheet provides a snapshot of a company’s financial position at a specific point in time, showing assets, liabilities, and shareholders’ equity.
Line items in a P&L statement represent specific categories of income and expenses. They significantly impact the overall profit and loss of a business, as they include important financial data such as revenue, cost of goods sold, operational expenses, and other costs associated with running a business.
Analyzing your P&L can provide valuable insights into improving your cash flow statement. By identifying areas of excessive spending or underperforming revenue streams, you can make strategic adjustments to enhance cash flow.
The frequency of reviewing a P&L statement can vary based on the specific needs of a SaaS company. However, it’s generally advisable to review this financial report monthly. Regular reviews enable companies to track their performance, spot financial trends or irregularities early, and adjust their strategies promptly.
