Templates
Real-Time SaaS Financial Model Template for Your Business
Learn more ->
If your business is off-kilter in any way, the right balance sheet template will highlight its issues and give you the chance to re-balance your organization.

When you learn about the balance sheet in school, it can seem a bit unnecessary or administrative, but when you’re in the FP&A world, the balance sheet is a lifeline. Our teams are constantly referencing the balance sheet to understand financial errors, find numerical discrepancies, and drive business alignment across the organization. It’s so much more powerful than it gets credit for, which is why it’s so important to get it right!
Content created by: Sasha Lamachenka, DemandGen Manager at Abacum
Table of contents
Author
Abacum Team
When it comes to doing business, there is one finance and accounting rule that most business owners learn very early on: a company’s equity should always equal its assets minus its liabilities. By relying on the format and the information within a balance sheet, business leaders can get a perspective on whether anything in their organization is out of balance.
With a simple balance sheet template, FP&A leaders can understand the financial health of the business, communicate business areas that may need extra support, and make decisions that factor in many key business metrics. For investors and other stakeholders, a company’s balance sheet contains critical financial ratios that provide important context when deciding to invest in a small business or provide a business loan.
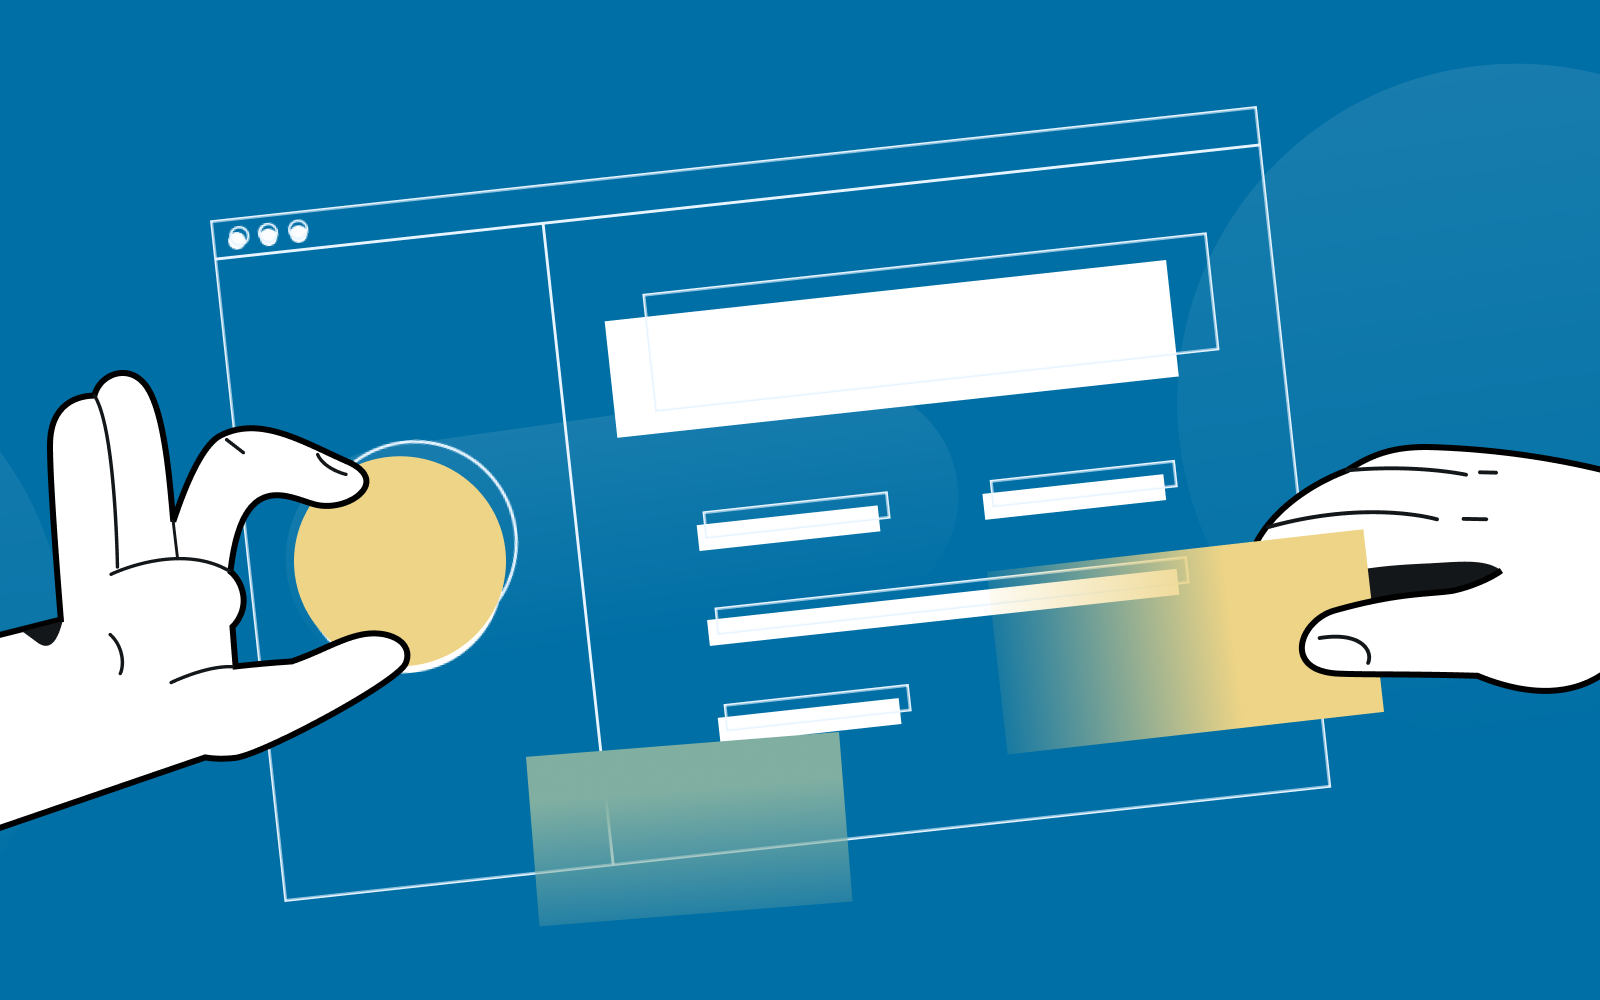
If you’re ready to increase the line of sight that your FP&A team has to financial matters across the entirety of your balance sheet, consider bringing your balance sheet template into the digital world with a SaaS solution or other next-generation platform that offers more robust analytical capabilities, simple data monitoring features, and even automated visualization components.
Below we’ll show you exactly how we would approach the balance sheet in a simplified, modernized way. From there, you can decide what works best for you and your organization moving forward.
For new businesses, mid-market businesses, and major Fortune 500 companies, the balance sheet is one of the three foundational financial statements that provide context regarding the financial performance of an organization.
When assessed in conjunction with the income statement and the cash flow statement, the balance sheet rounds out financial analysis and modeling within a business, focusing on total assets, total liabilities, and total equity.
Each key financial statement helps paint a portion of the overall financial picture. The income statement highlights how much money is coming in and whether or not it’s enough to cover expenses; the cash flow statement clues decision-makers into the liquidity of a small business and how much cash is on hand; the balance sheet ties everything together, calling out if your organization is taking on too much liability or not making the right investments in current assets or long-term assets.
When looking at a balance sheet from top to bottom, three sections are the focus: total assets, total liabilities, and total equity. These sections, of course, are further broken down into current assets, fixed assets, current liabilities, long-term debt, and more.
To understand how “balancing” a balance sheet works in practice, it’s imperative to understand what each of these categories is and how they relate to one another.
Think of assets as the items of value that your company owns. These items contribute to the overall valuation of your company and can vary widely; new manufacturing equipment is an asset, but so is the furniture in your office. To get a more granular look into the total assets section of a balance sheet template, many organizations further break down total assets into:
Here, you’ll see line items such as cash, accounts receivable, inventory, prepaid expenses, and short-term investments. These items usually have a lifespan of less than one year and can be easily converted to cash. If your small business doesn’t have sufficient current assets, you could be at risk of not being able to finance day-to-day operations.
Sometimes referred to as long-term assets, fixed assets are not as liquid as their short-term counterparts, and they have a lifespan of more than one year. Long-term investments, land, buildings, equipment, and furniture are all considered fixed assets.
You can even have assets that are considered “intangible assets,” such as patents, trademarks, or other intellectual property. These assets will likely experience depreciation over time, so be sure to factor that into your financial models.
On the other side of the balance sheet, total liabilities represent all the debt your business has taken on. In practice, many FP&A teams think of this as accounts payables, but in reality, that is only a small portion of a business’s total liabilities. Just like in the assets section, this section is further broken down into current liabilities and long-term liabilities.
If there are debts that you plan to pay back within a year, they’ll fall under the current liabilities subsection. Accounts payable, short-term notes, interest payable, taxes payable, and accrued payroll are all current liabilities.
If you don’t need to pay debts within the current fiscal year, they’ll be filed under “long-term liabilities.” Mortgages are a major long-term liability that many businesses incur, but you may also see capital lease obligations here.
Total equity, which you may see as shareholder’s equity or owner’s equity, is the retained earnings that are leftover when you subtract total liabilities from the total assets on your balance sheet. Essentially, this is the overall value of your company. The formula is:
Total Equity = Total Assets – Total Liabilities
As the name suggests, the balance sheet template requires both sides of the balance sheet to balance. If the equation above doesn’t balance, or, if your total liabilities plus your total equity doesn’t equal total assets, something is wrong. If something is out of balance, then the numbers being used on the line items in your balance sheet are off somewhere.
Instead of manually searching all your numbers, consider implementing a technological solution to balance your balance sheet. With a robust FP&A platform that automatically populates the necessary cells within your balance sheet template and provides preliminary data checks, you’ll spend a lot less time sifting through minor details of the balance sheet to figure out what’s missing or being overstated.

When it comes to running your business finances effectively, the idea is that you should always have enough assets on hand to cover the liabilities you take on. If you have too much debt and not enough cash or liquid assets to cover your debt, you’ll become a risk to lenders, investors, and shareholders.
When using a three-statement financial system, businesses will regularly analyze their balance sheet, income statement, and cash flow statement. These three financial statements tell different stories and offer unique insights, but they all tie into each other in some way.
The income statement which is meant to showcase the net loss or net profit of a small business within a given period, flows through to the balance sheet via the “retained earnings” line in the total equity section of the balance sheet. Further, depreciation flows out of the balance sheet and into the income statement as an expense.
None of these three financial statements operate in a silo; they all link back to one another in some way, creating a natural cycle of checks and balances for your FP&A team. If something isn’t balancing, the answer is in your numbers somewhere!
When you have an effective balance sheet template, whether you’re using Microsoft Excel templates, a simple balance sheet template, a free balance sheet template you found online, or something more sophisticated, you’ll be able to work with a number of key financial ratios to help tell the story of your company’s financial position.
To understand how much of a company’s assets were purchased with debt, the debt ratio is often used. Usually, a result of 0.4 or lower is preferable. The formula is:
Total Debt Ratio = Total Liabilities / Total Assets
Displaying a company’s ability to pay off short-term debts, or current debts, within a year, the current ratio formula is:
Current Ratio = Current Assets / Current Liabilities
This ratio is very similar to the current ratio, but it showcases how capable a company is of paying short-term debts within a year with all of its assets excluding inventory. Inventory is not as liquid as other current assets, so it’s excluded from this formula.
Quick Ratio = (Current Assets – Inventory) / Current Liabilities
To get an idea of how “indebted” a small business is to its shareholders, the debt-to-equity ratio is here to help. It should be between 1 and 2 if a business is healthy and hasn’t taken on more debt than it should.
Debt-to-Equity Ratio = Total Liabilities / Total Shareholder’s Equity
When an organization’s equity multiplier is low, it means that a small business is financing its own assets instead of relying on investments from shareholders to secure new assets.
Equity Multiplier = Total Assets / Total Equity
As illustrated by the formulas above, your balance sheet is a wealth of information. It can provide critical detail to your FP&A teams, company executives, investors, lenders, and shareholders.
Some of the key insights from the balance sheet are:
When it comes to building your balance sheet, the process can be as simple or complex as you choose, as long as one thing is always true: it balances! The balance sheet format can vary, but it should be effective enough to help you make business decisions.
Small businesses or new businesses may be able to get away with a simple Microsoft Excel or Google Sheets workbook, but as organizations grow and change, a more advanced solution is needed.
What if we told you that you could tap into the benefits of a balance sheet template that automatically updates, connects on the back end to all your data sources (no manual data pulls!), and provides all the key analytics that you need when it comes to this financial statement? Would you believe us? If you’re skeptical, we don’t blame you. We’ll show you instead.
Abacum is a SaaS solution that was designed with FP&A teams in mind. It’s more advanced than traditional accounting software and can grow with your business. Our platform simply consolidates all your data sources, allows you to customize the mappings for each financial statement, and automatically updates everything on a regular basis. All the financial insights you need are literally seconds – and a few clicks – away.
When it comes to your balance sheet, you’ll see the actuals v. budget v. forecast display without any extra work. At a glance, you can tell if certain aspects of the business are missing planned targets, giving you a blueprint for how to proceed in whatever decision-making process you’re conducting.
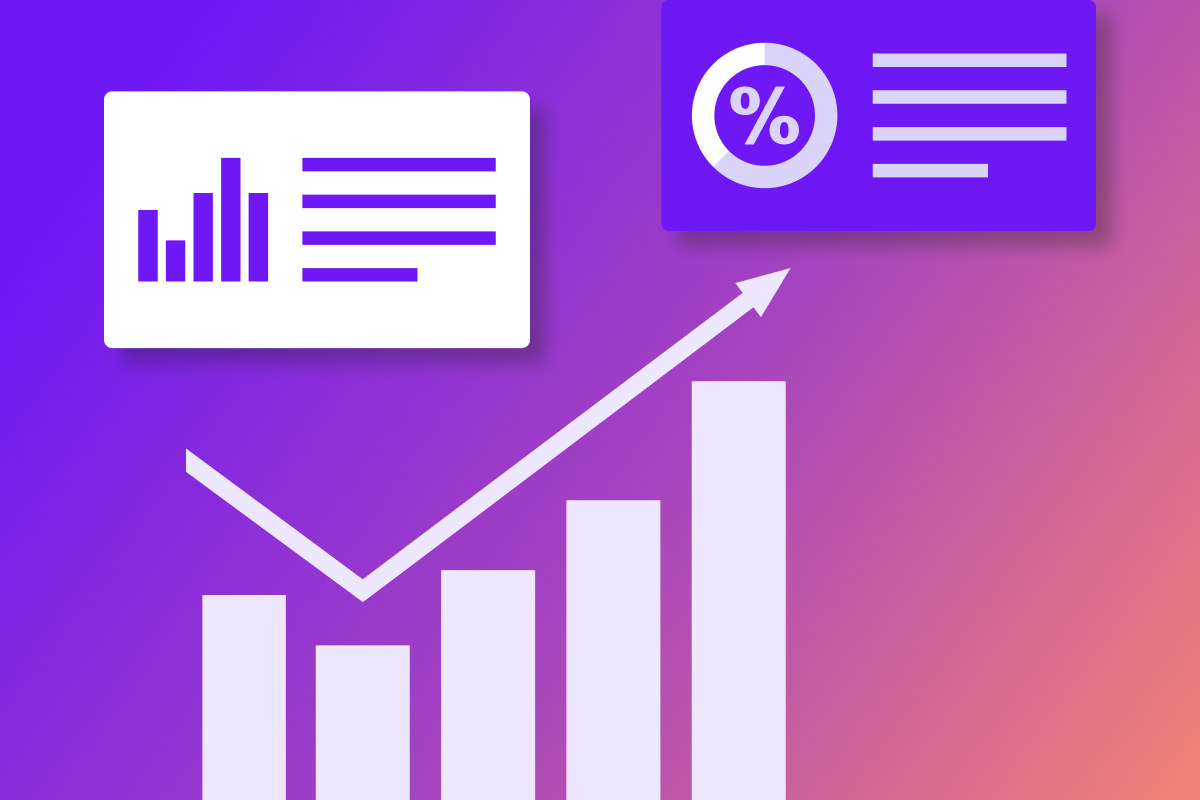
Even further, you can place critical visualizations directly next to the balance sheet template itself. To get a closer look at the working capital of your business, you can rely on charts and graphs to illustrate spikes or drops over time.
Scrolling down, you can look at the balance sheet actuals on their own. Clicking into each line item will give you detailed information that is much more actionable than the consolidated view. Finally, all the key metrics that come from your balance sheet are calculated in real-time and updated regularly, just like the data sets themselves.
When your FP&A team is looking at the balance sheet, there are a few key metrics that are best to have at-a-glance. Instead of your expert employees spending time doing these calculations and updating the results with new information, having them at the ready and updated at all times is a major time saver. Let’s take a look at a few of them.
The Days Receivable metric shows how many days it takes to collect debts and outstanding customer payments. Accounts receivable and cash collection is one of the most critical functions for any business. If you can’t collect the debts you are owed by customers or other entities, you’ll quickly run out of cash flow and your business operations will be threatened.
If you are taking a long time to pay off your business debts, lenders and investors might hesitate to partner with you in the future. You could also face fines and related fees if your contracts have payment dates that were agreed upon ahead of time. This metric will tell you how long it’s taking you to pay off your liabilities.
This shows the total outstanding dollar amount you have to collect from customers. Instead of the days it’s taking to collect those debts, this metric tells you how much money you could have in your possession if you collected the funds you are owed.
Similarly, accounts payable will display the total dollar amount that your business owes to its debtors. If this number gets too high, you could end up defaulting on certain loans or failing to make payments on time, jeopardizing the future financial health of your organization.
Working capital will tell business leaders exactly how liquid their organization is. It assesses the current assets and current liabilities of a business to determine the short-term functionality of the business.
Our SaaS solution was built with FP&A teams at the core of our mission. Just like those same teams are at the core of business functions today, our tool enables next-generation analytics, employee productivity, and even heightened financial accuracy.
The advanced balance sheet template that we designed can help you find your company’s net worth and understand the overall financial health of your organization. If you are looking for a dedicated financial forecasting tool that highlights your balance sheet outcomes and models future scenarios, Abacum is the solution your business needs. Book a demo with us today to create better business outcomes than you could have ever imagined.
A balance sheet shows an organization’s assets, liabilities, and equity, but a P&L statement only highlights the profit or loss of that organization within a certain period. The outcome – Net Loss or Net Profit – of the P&L statement flows through the balance sheet, but the balance sheet is a more holistic overview of the company’s financial health.
Yes. On your balance sheet, your assets should always equal total liabilities plus total equity. Always, always, always. If these numbers don’t balance, it’s a surefire signal that something is wrong. Either something isn’t flowing through to the balance sheet as it should, or there are misrepresented numbers somewhere.
When you want an overall picture of your financial health, turn to your balance sheet. It can tell you if you’re taking on too much debt, aren’t bringing in enough funds to cover your costs, or are overly dependent on investor money to keep your business running. There are many, many ways to use the information in the balance sheet for financial planning, but these are some of the central use cases.
Abacum makes balance-sheet management easy with templates, know how