 Reporting
 Planning
 Intelligence
 Integrations
 For CFOs
 For Finance Managers
 For Operations
 Revenue Planning
 Headcount Planning
 OpEx Planning
 Performance Management
 Investor Reporting
 Blogs
Blogs
 Guides
 Webinars
 Upcoming Events
 About
About
 Careers
Unlock efficient growth with a best-in-class financial dashboard software
Combine financial and operational KPIs, automate customer reporting dashboards, and share real-time insights that fuel data-driven decisions.
FP&A teams automating their financial dashboards with Abacum


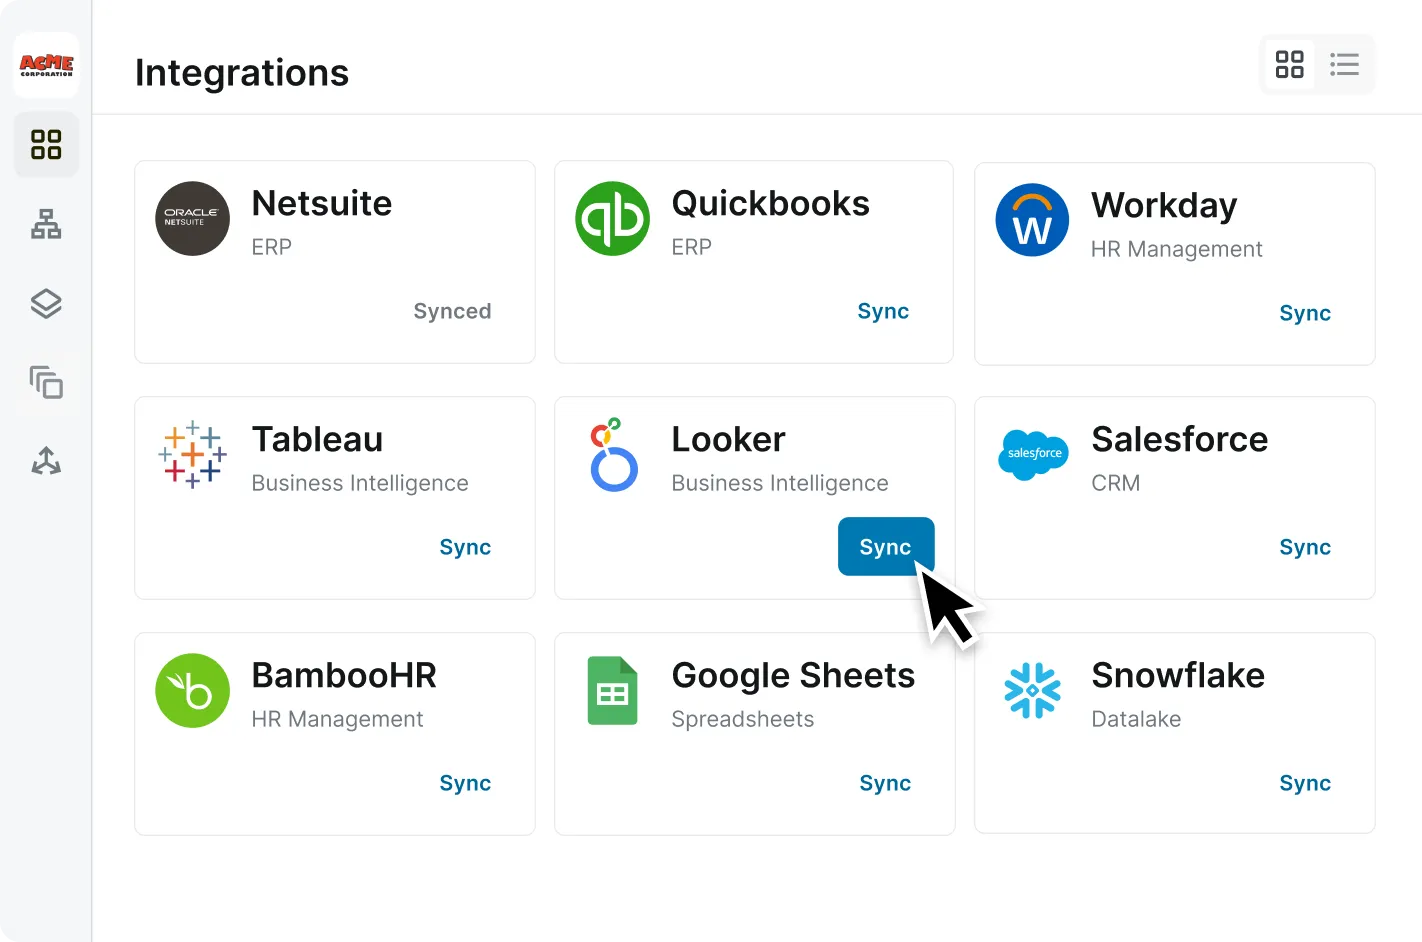
All of your business data, in a single place
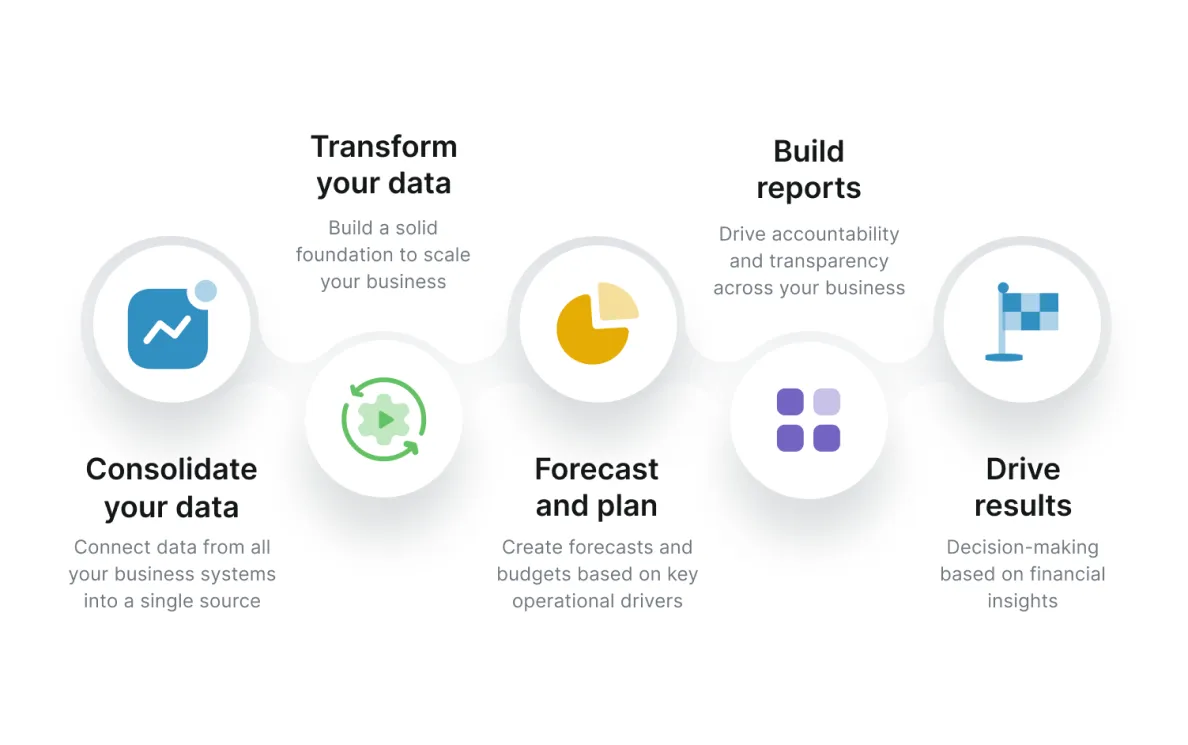
Abacum’s best-in-class integrations are designed for true peace of mind, making sure your metrics are always both automated and accurate. With Abacum, you can integrate all your business systems to automatically visualize your financial, operational, and workforce metrics in a single dashboard. With flawless functionality and native support for data consolidations or multiple entities, your data integrity is always guaranteed, even for your most complex dashboarding needs. Abacum replaces your data copy-paste and empowers you with real-time, self-serve dashboards, enabling you to be independent of limited IT or BI resources.
Focus on the big picture with unparalleled visibility
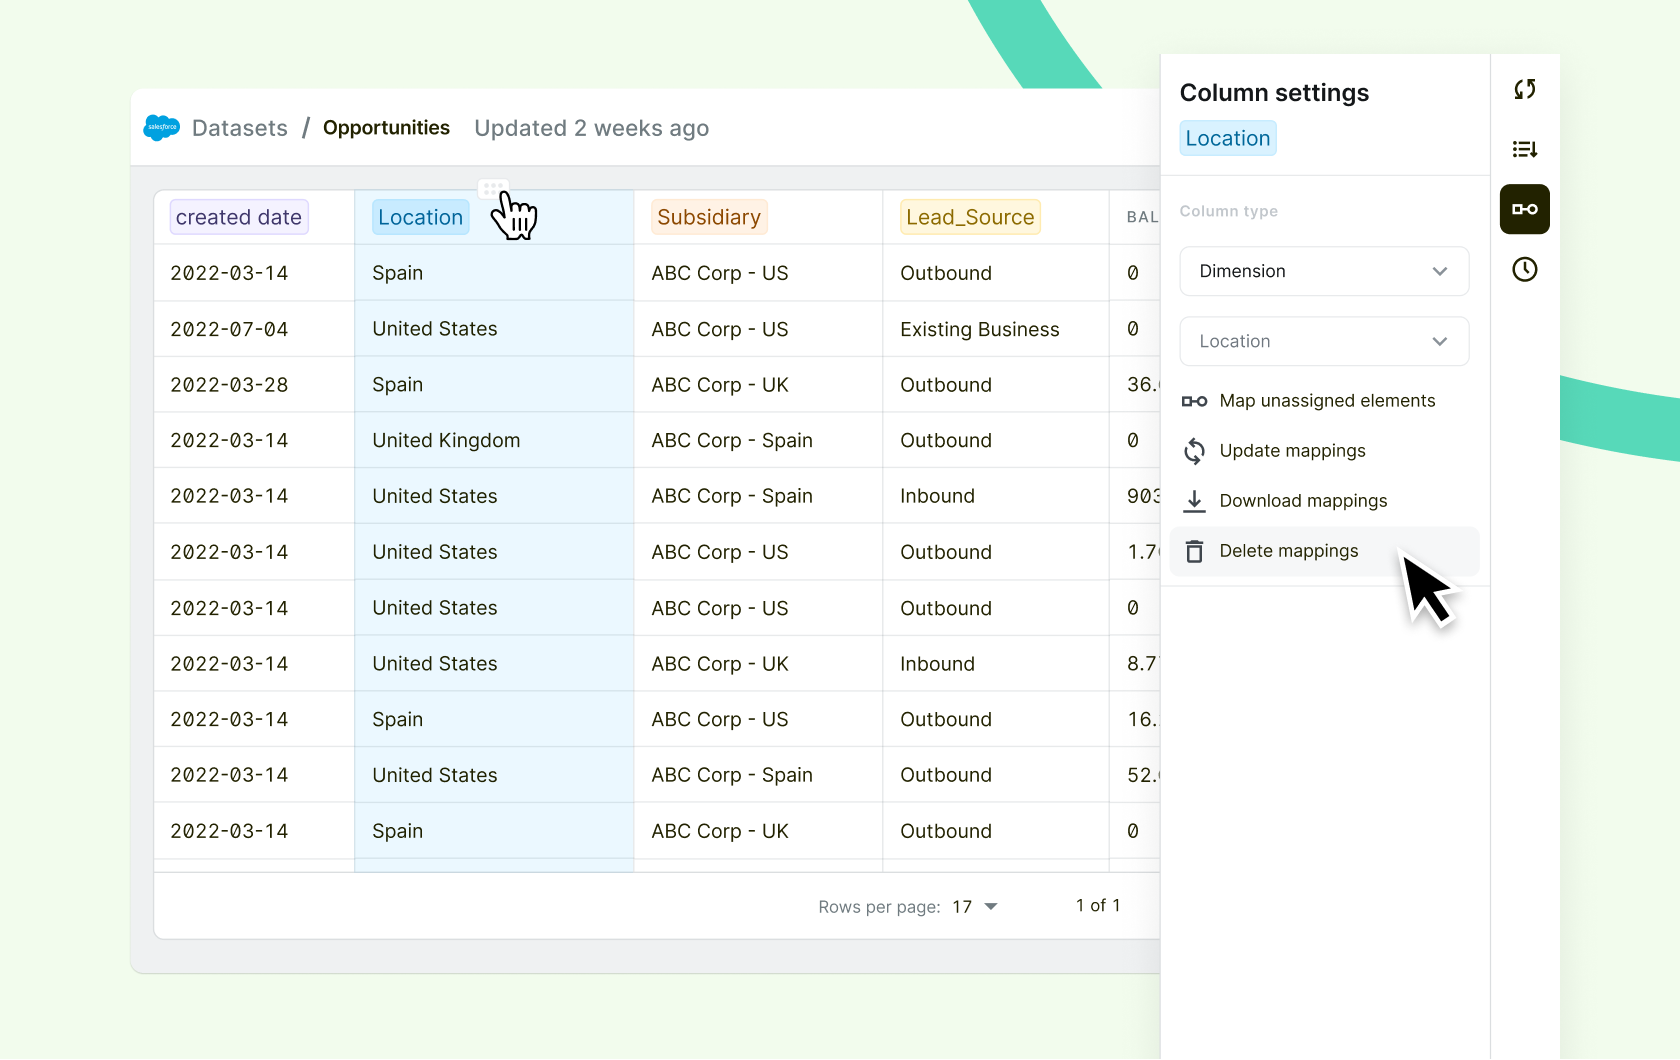
Transform your static dashboards into dynamic and real-time business insights. From the big picture to the smallest detail, you can drill down to your source transactions for instant reporting granularity, and unparalleled visibility into every journal or data entry. Abacum turns your data into insights by enabling you to slice and dice your KPIs, helping you uncover the “why” behind the “what” for any business metric or performance trend. Understanding what really moves the needle through multi-dimensional visibility has never been this simple.
Easily compare financial plans and actuals
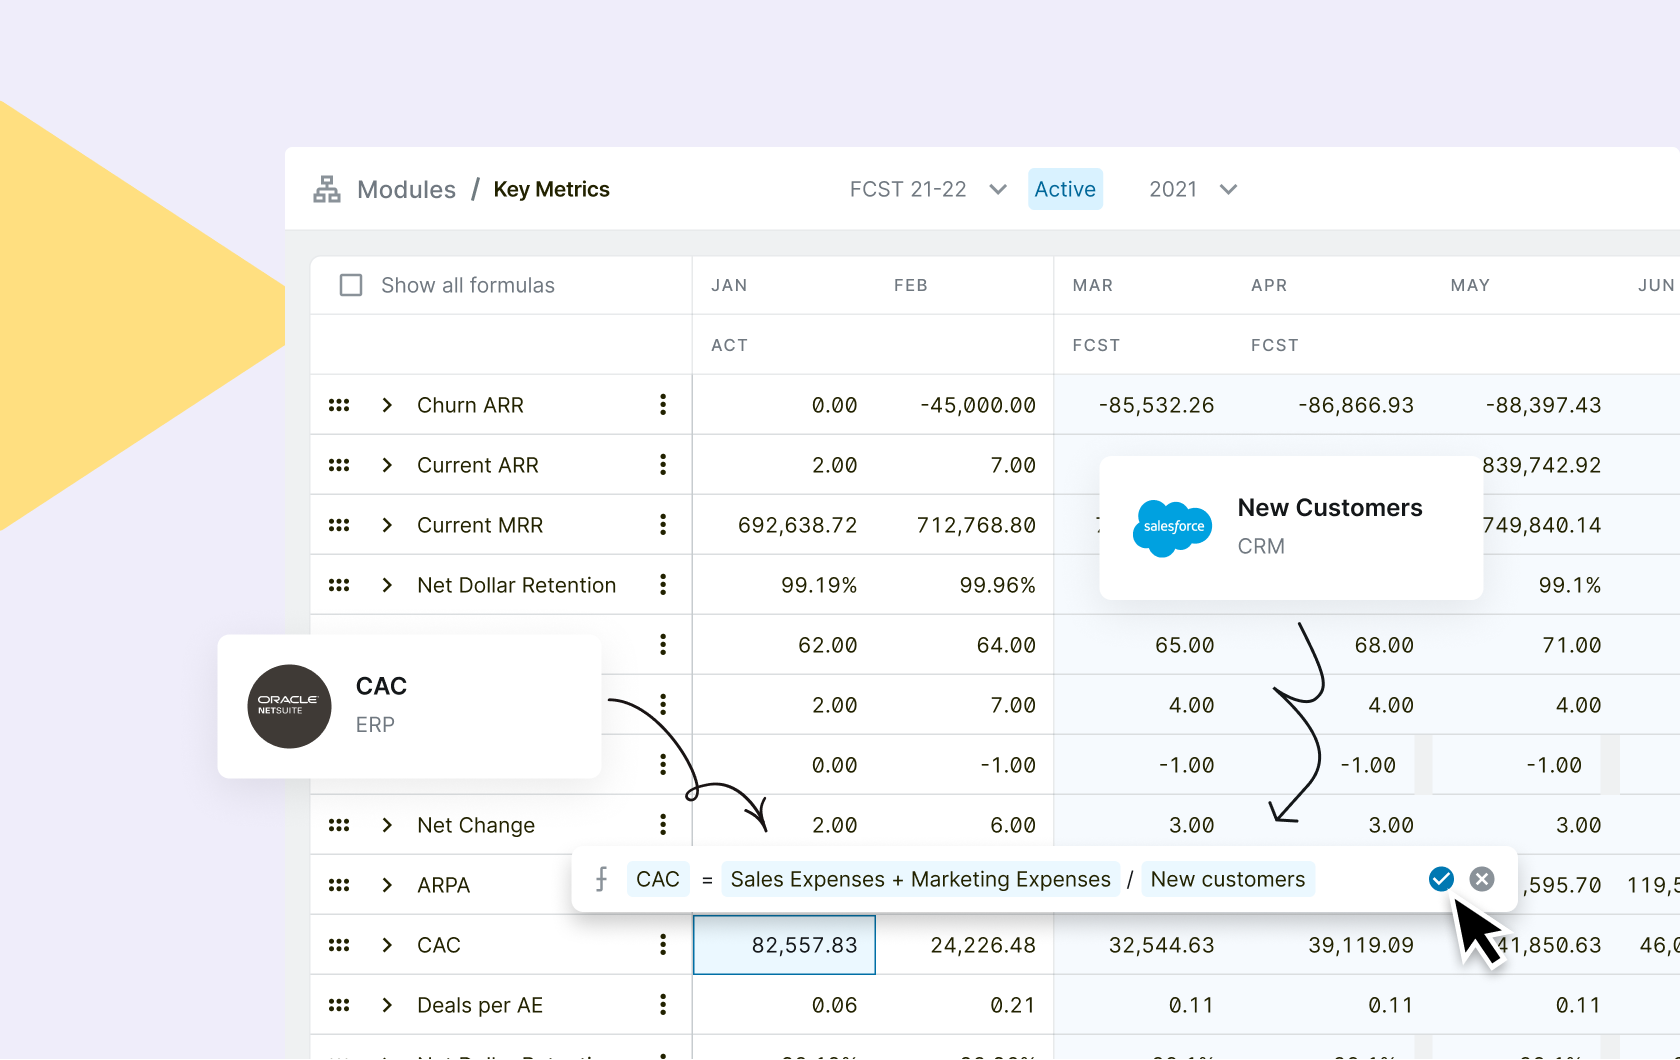
Financial dashboards in spreadsheets or BI solutions can be hard to understand, and often only limited to historical information. With Abacum, you are immediately able to build and visualize intuitive dashboards that combine your historical and forecasted business performance. Abacum lets you analyze your ARR, sales pipeline, departmental OPEX, or financial ratios in a matter of clicks. Making sure you can instantly see budget vs. actuals, your rolling forecast, and any downstream effect of your KPI performance. It has never been so fast and seamless to compare and share your BvA on a monthly, quarterly or annual basis. Start spending less time preparing and building reports, and more time discussing the way forward.
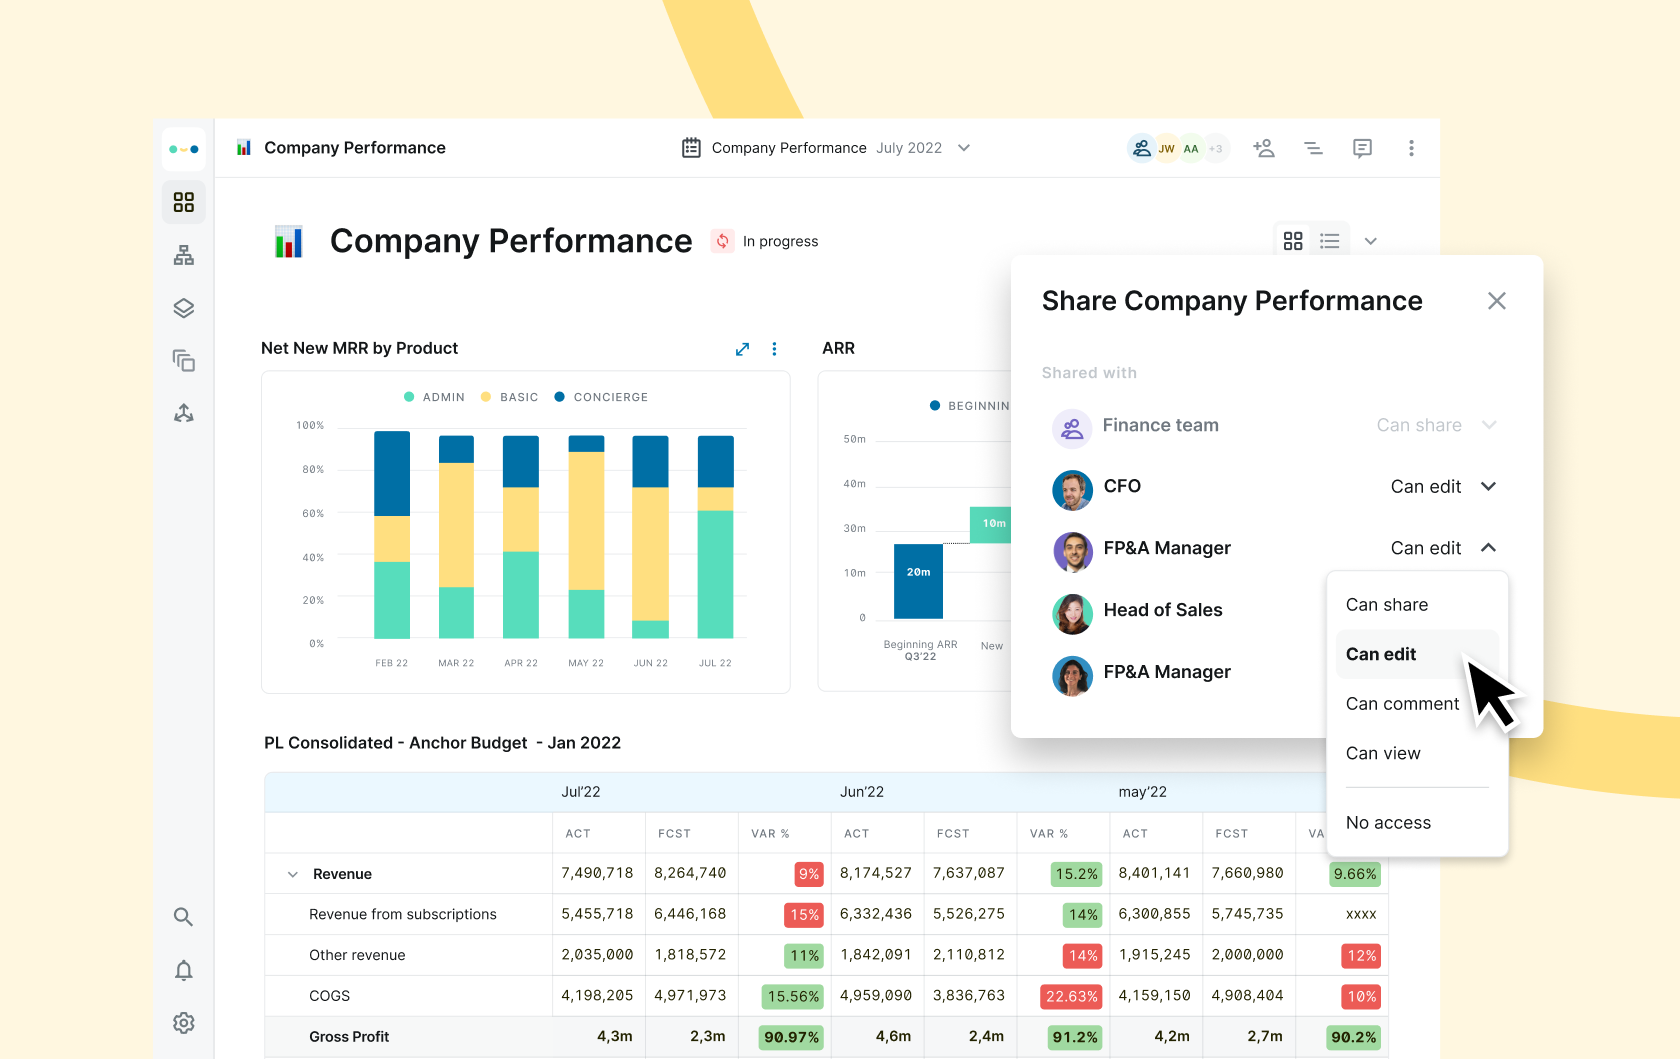
Focus the discussion on results with real-time performance
Abacum’s dashboarding capabilities allow you to establish accountability for driving performance throughout your organization. You can tailor the content, metrics, and reporting layout of all your dashboards with ease, as well as create, customize, filter, clone, and share your dashboards to key stakeholders with just one click. This ensures that decisions are made based on up-to-date data throughout the month rather than waiting until data is two weeks old. Additionally, Abacum’s precise user permissions enable you to manage who has access to each of your business’s dashboards and when they can access them, giving you peace of mind.
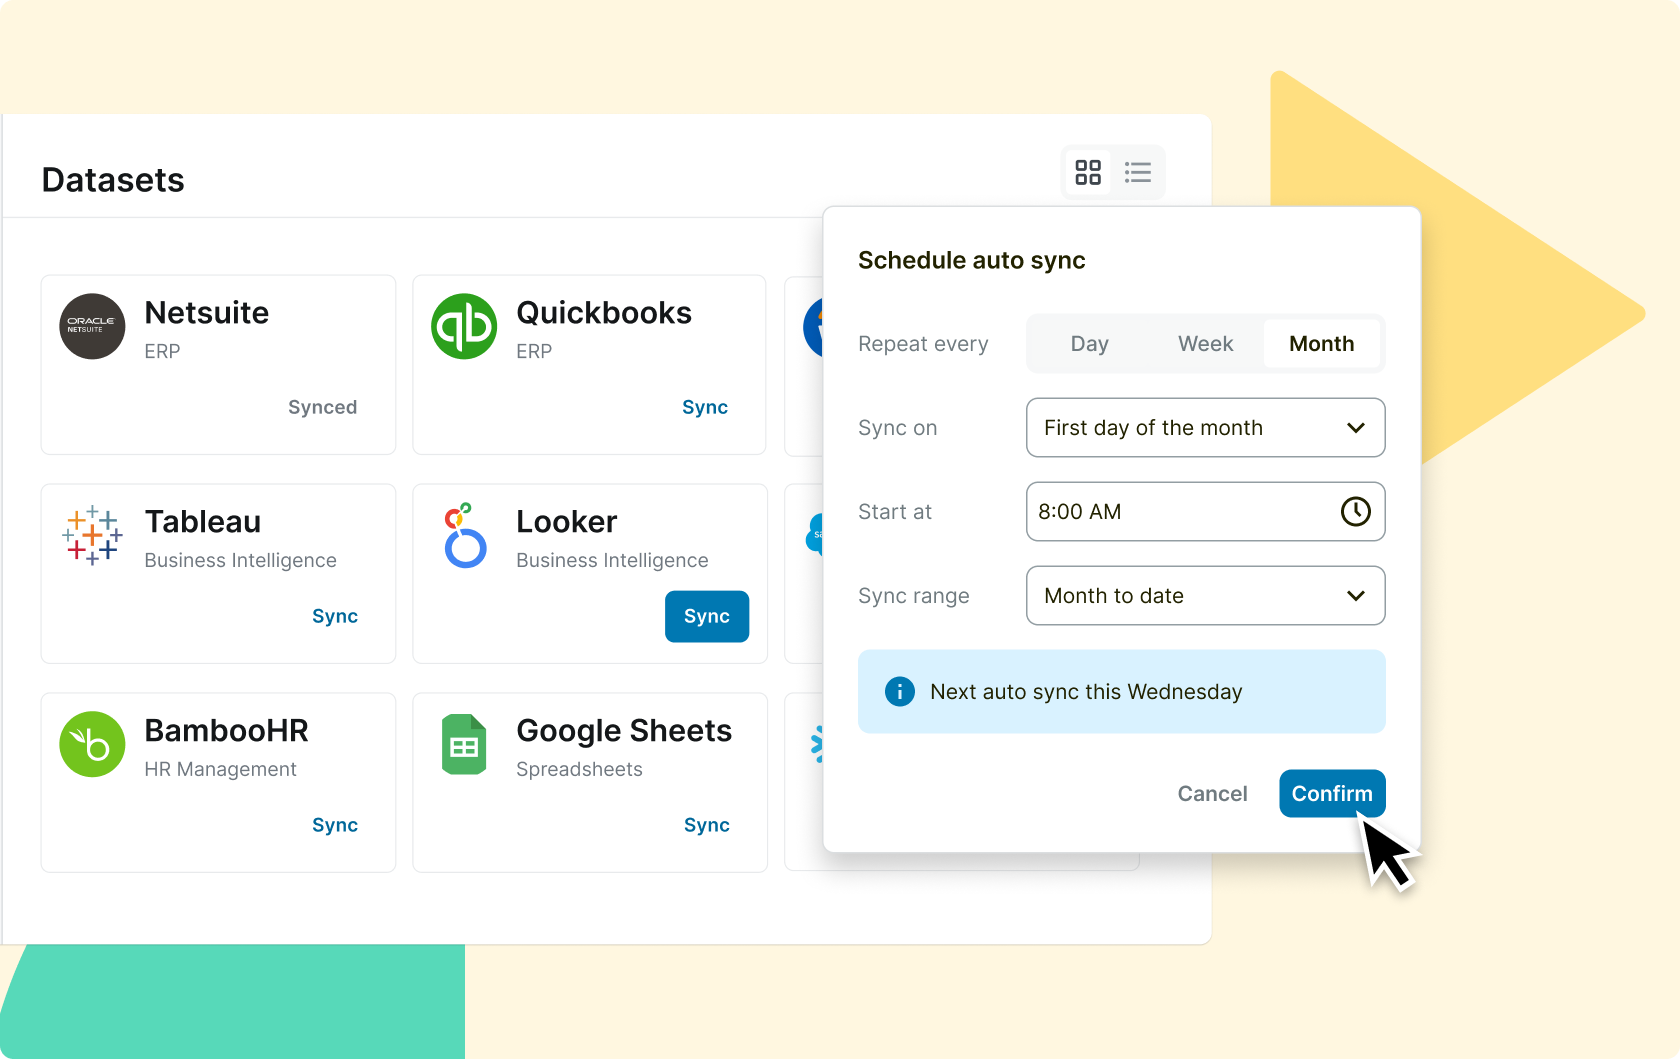
Connect all your data sources in a single platform
Get a comprehensive understanding of your operational performance by consolidating all your business data into one reliable source.

Xero

Tableau

Salesforce


Quick setup with seamless integrations
Centralize your data into one reliable source to simplify your data management

Data granularity at a dimensional level
Improve decision-making with actionable insights derived from detailed data analysis

Intuitive interface experience
Collaborate with your team smoothly using a user-friendly platform
Grow your business with automated financial dashboards
Eliminate the hassle of managing spreadsheets and give your finance team the power to enhance their productivity with Abacum. Its intuitive interface and visualization capabilities foster collaboration across departments, enabling stakeholders to engage with ease. With Abacum’s financial dashboard software, you can unlock your finance team’s full potential by combining financial and operational KPIs, automating custom reporting dashboards, gaining in-depth insights into your business operations, and aligning your strategies with your company’s goals.
Join Abacum’s list of heroes
Become part of our community of finance professionals.

Pierina Nuques
Head of FP&A
“The onboarding process with Abacum was fast and efficient. Their implementation team provided us with the full support needed to use the platform for our month-end reporting, freeing up a lot of time from manual work.”
MedTech

Maria Ares
VP of Finance
“With 8 countries and the complexity of dealing with multiple currencies, Abacum automated our manual tasks, accelerated the process of P&L reporting, and gave us more time to produce better analysis.”
EdTech

Francesc M.
Strategic Finance
“We went from budgeting in spreadsheets, to unlocking collaboration and better decisions with 30+ budget owners.”
FinTech
Still have questions? We’ve got answers.
What is a Financial Dashboard?
A financial dashboard is a visual representation of a startup’s financial performance. Leveraging tables, charts, and graphs provides a snapshot of critical financial and operational metrics, or key performance indicators (KPIs). Financial dashboards often report data in real-time, saving you valuable time, and include several financial metrics such as revenue, ARR, churn, expansion, profit margin, cash flow, and more.
What are the benefits of a Financial Dashboard?
Financial dashboards have several benefits, some of which are listed below:
- Improved financial management: Financial dashboards provide a quick and easy way to track financial performance, identify trends, and make informed decisions.
- Increased operational efficiency: By consolidating financial data from multiple sources, financial dashboards save time and effort for CFOs, the VP of Finance, and other stakeholders.
- Enhanced performance visibility: Financial dashboards provide a custom dashboard that has essential financial reports, allowing stakeholders to see the same information and make informed decisions together.
- Improved business accountability: Financial dashboards allow CFOs, VP of Finance, and other stakeholders to communicate financial data more effectively, making it easier to collaborate and work together.
What are some examples of Financial Dashboards?
- Leadership Team Dashboard: This financial dashboard is used by the CFO as it provides a comprehensive view of your company’s financial health. It should include metrics such as revenue, profit margin, operating expenses, current assets, current liabilities, and debt-to-equity ratio amongst others. The goal of a Leadership Team Dashboard is to provide key stakeholders with real-time business trends to make informed decisions.
- Financial Reporting Dashboard: A Financial Reporting dashboard helps you track the company’s historical and forecasted financial performance. It should include key metrics such as return on assets, return on equity, debt-to-equity ratio, working capital ratio, revenue, expenses, balance sheet, and gross profit margins. The goal of a Financial Reporting dashboard is to enable CFOs, VP of Finance, FP&A, and other key business stakeholders to easily understand the financial performance of your business.
- Cash Flow Dashboard: A Cash Flow dashboard can be used to track and analyze your company’s cash flow, including both inflows and outflows. The metrics your Cash Flow dashboard should include are accounts receivables, accounts payable, and cash reserves.
- Budget vs. Actual Dashboard: A Budget vs. Actuals dashboard will help you track your historical financial performance against your budget financial performance. It should include actuals and budgets for key metrics such as revenue, expenses, and profit margins.
What should the key capabilities of a Financial Dashboard be?
The best Financial Dashboard goes beyond visualizing your financial and operational metrics. They need to make it easy and intuitive to explore and leverage your data to provide a holistic view of your business performance. It needs to be able to combine real-time data from all your business systems, letting you create custom metrics and interactive dashboards that business leaders can explore.